Bullish and Bearish Engulfing Candlestick Pattern
The Bullish and Bearish Engulfing patterns are powerful two-candle formations that often signal potential trend reversals in the market. Understanding these patterns can provide traders with valuable insights into market sentiment shifts and offer timely entry or exit points. These patterns are widely used in technical analysis across various financial markets, including stocks, forex, and cryptocurrencies.
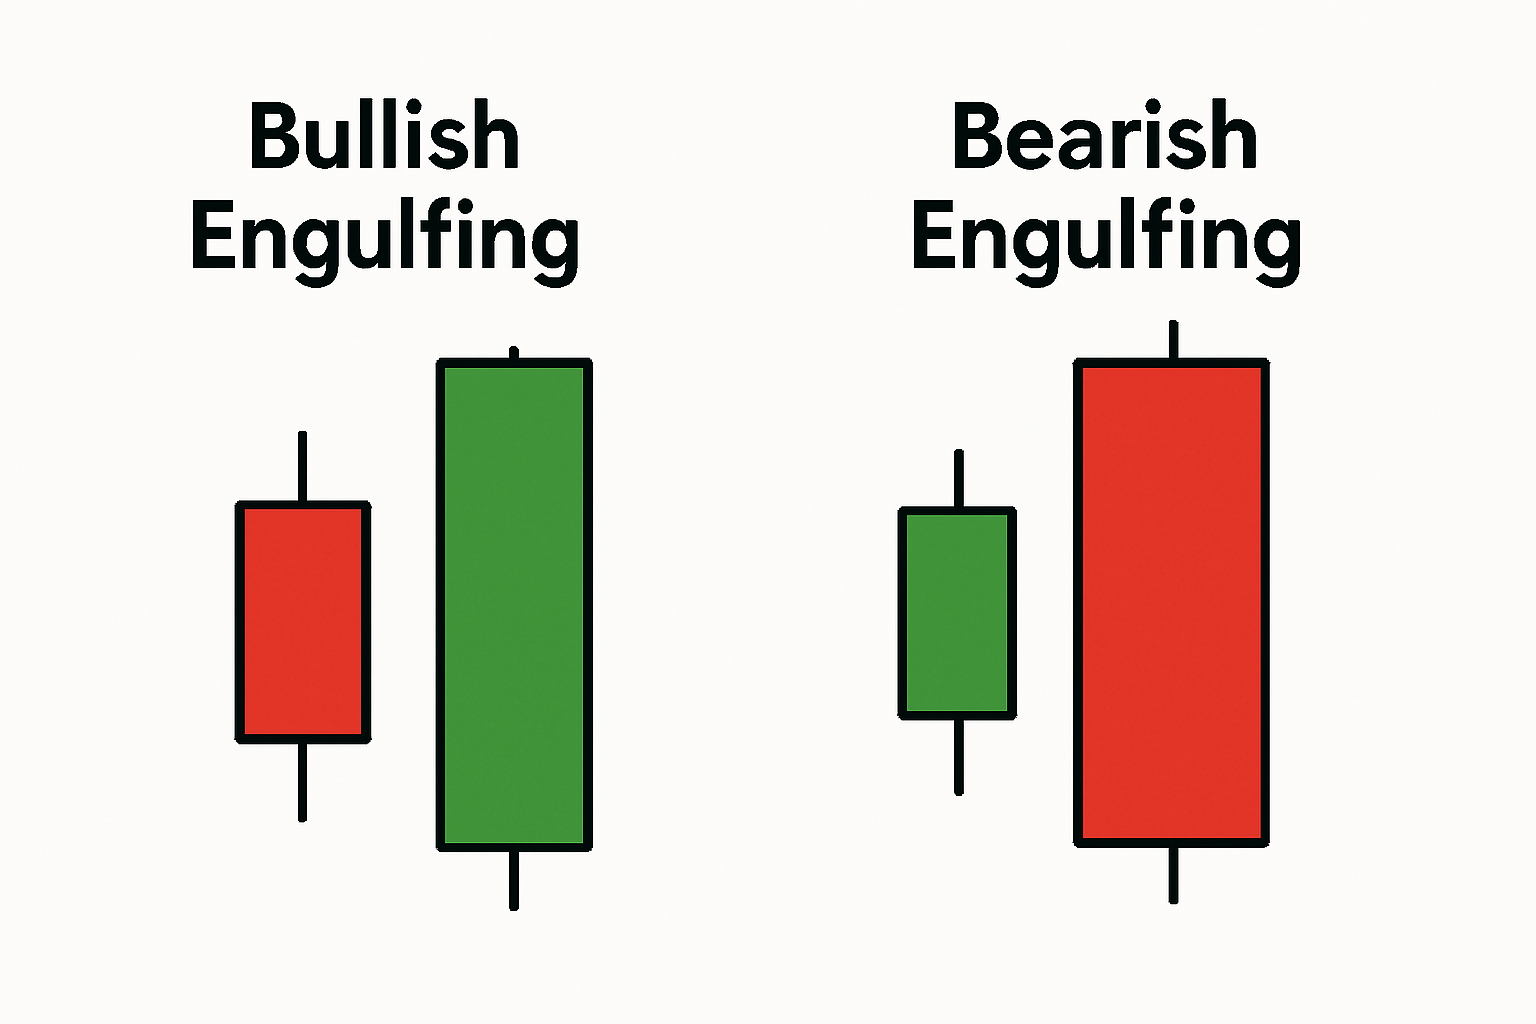
Engulfing patterns are characterized by a second candle's real body completely "engulfing" the real body of the preceding candle. The effectiveness of these patterns can be enhanced when they appear after a sustained trend and are confirmed by other technical indicators or volume analysis.
What is a Bullish Engulfing Pattern?
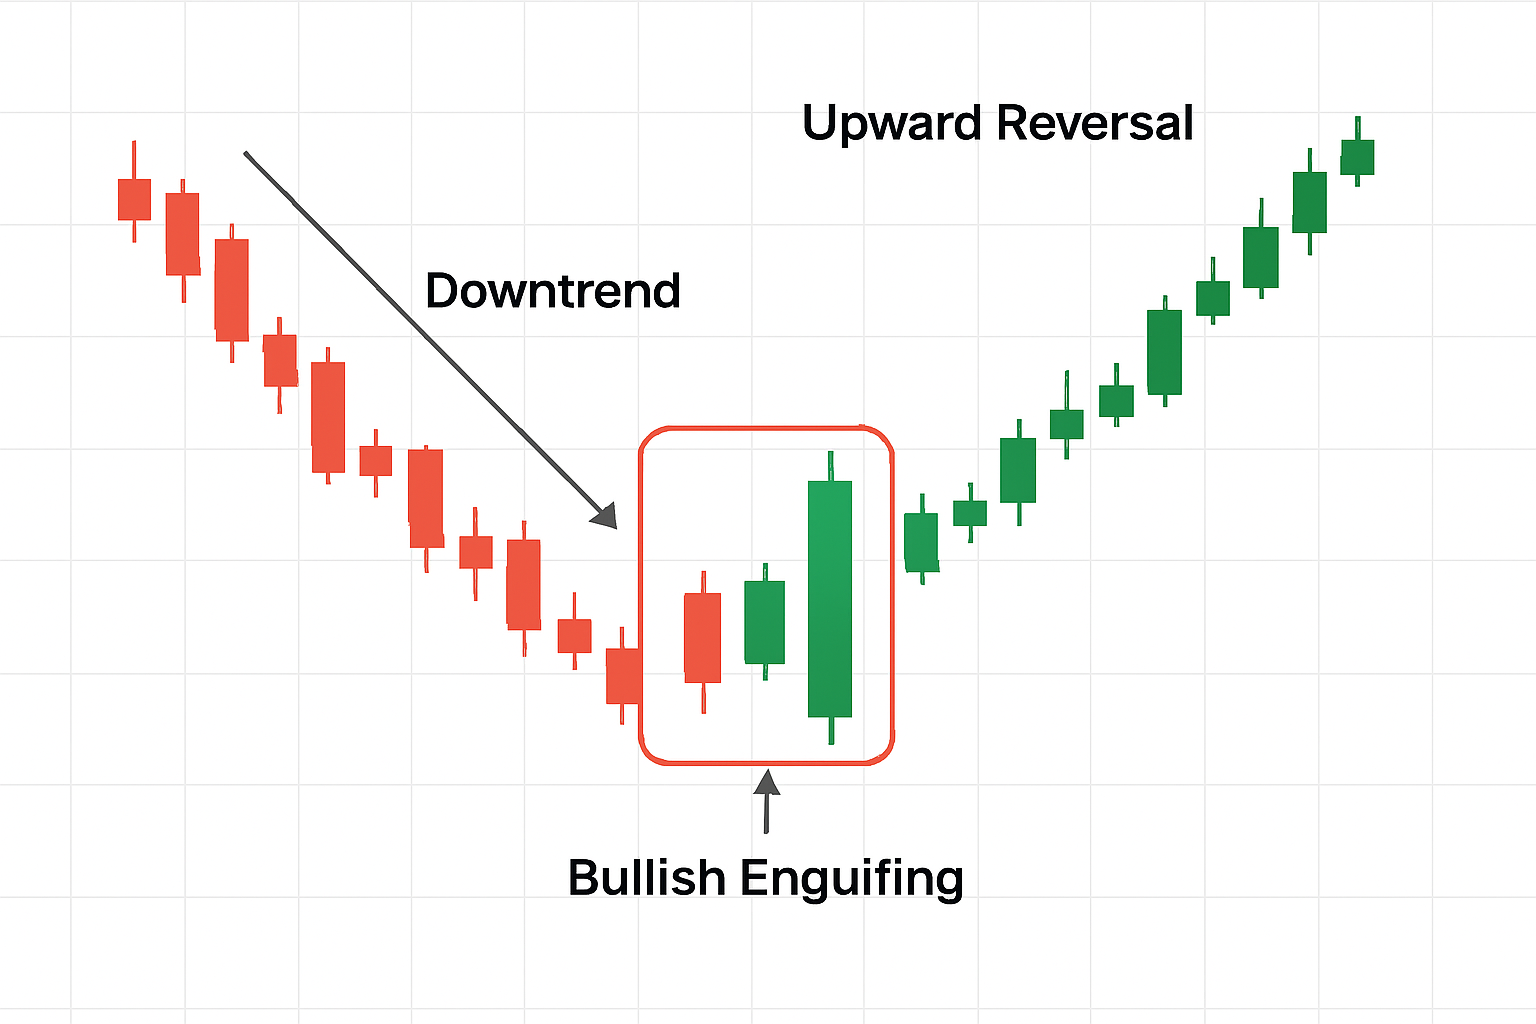
A Bullish Engulfing pattern is a strong bottom reversal signal that appears after a downtrend. It consists of two candles: the first is a bearish (or black/red) candle, indicating selling pressure. The second candle is a bullish (or white/green) candle that completely "engulfs" the real body of the first candle. This means the second candle opens lower than the first candle's close and closes higher than the first candle's open. The engulfing nature of the second candle signifies that buying pressure has overwhelmed selling pressure, suggesting a potential shift from a downtrend to an uptrend. The larger the engulfing candle, the stronger the signal is considered to be. This pattern highlights a significant change in market sentiment where bulls have decisively taken control from bears.
How to Identify a Bullish Engulfing Pattern
Identifying a Bullish Engulfing pattern requires careful observation of candlestick formations on a price chart. Here are the key characteristics to look for:
- Established Downtrend: The pattern should appear after a clear and discernible downtrend. Its significance is diminished if it forms during choppy or sideways price action.
- First Candle: The first candle of the pattern must be a bearish candle, reflecting the prevailing downtrend.
- Second Candle: The second candle must be a bullish candle.
- Engulfing Body: The body of the second (bullish) candle must completely engulf the body of the first (bearish) candle. This means the open of the second candle is lower than the close of the first, and the close of the second candle is higher than the open of the first. The wicks (shadows) of the first candle do not necessarily need to be engulfed, although some traders prefer to see the entire range (including wicks) engulfed for a stronger signal.
- Confirmation (Optional but Recommended): While the pattern itself is a strong signal, traders often look for confirmation. This could be in the form of the next candle closing above the high of the engulfing candle, increased volume on the day of the engulfing candle, or other technical indicators signaling a bullish reversal.
How to Trade a Bullish Engulfing Pattern
Trading the Bullish Engulfing pattern involves looking for an entry point after the pattern has formed and managing risk appropriately. Here's a common approach:
- Entry: A common entry strategy is to place a buy order slightly above the high of the second (engulfing) candle. This provides some confirmation that the bullish momentum is continuing. Aggressive traders might enter near the close of the engulfing candle, but this carries more risk.
- Stop-Loss: A stop-loss order is typically placed below the low of the engulfing candle, or sometimes below the low of the first candle, depending on the trader's risk tolerance. This helps to limit potential losses if the pattern fails and the price continues to move downwards.
- Take-Profit: Take-profit targets can be set based on previous resistance levels, a measured move projected from the pattern, or a specific risk-to-reward ratio (e.g., 1:2 or 1:3). It's important to have a clear exit strategy before entering the trade.
- Confluence: The reliability of the Bullish Engulfing pattern increases when it occurs in conjunction with other bullish signals. This could include support levels, bullish divergences on oscillators like the RSI or MACD, or increased trading volume accompanying the engulfing candle, which indicates strong buying interest.
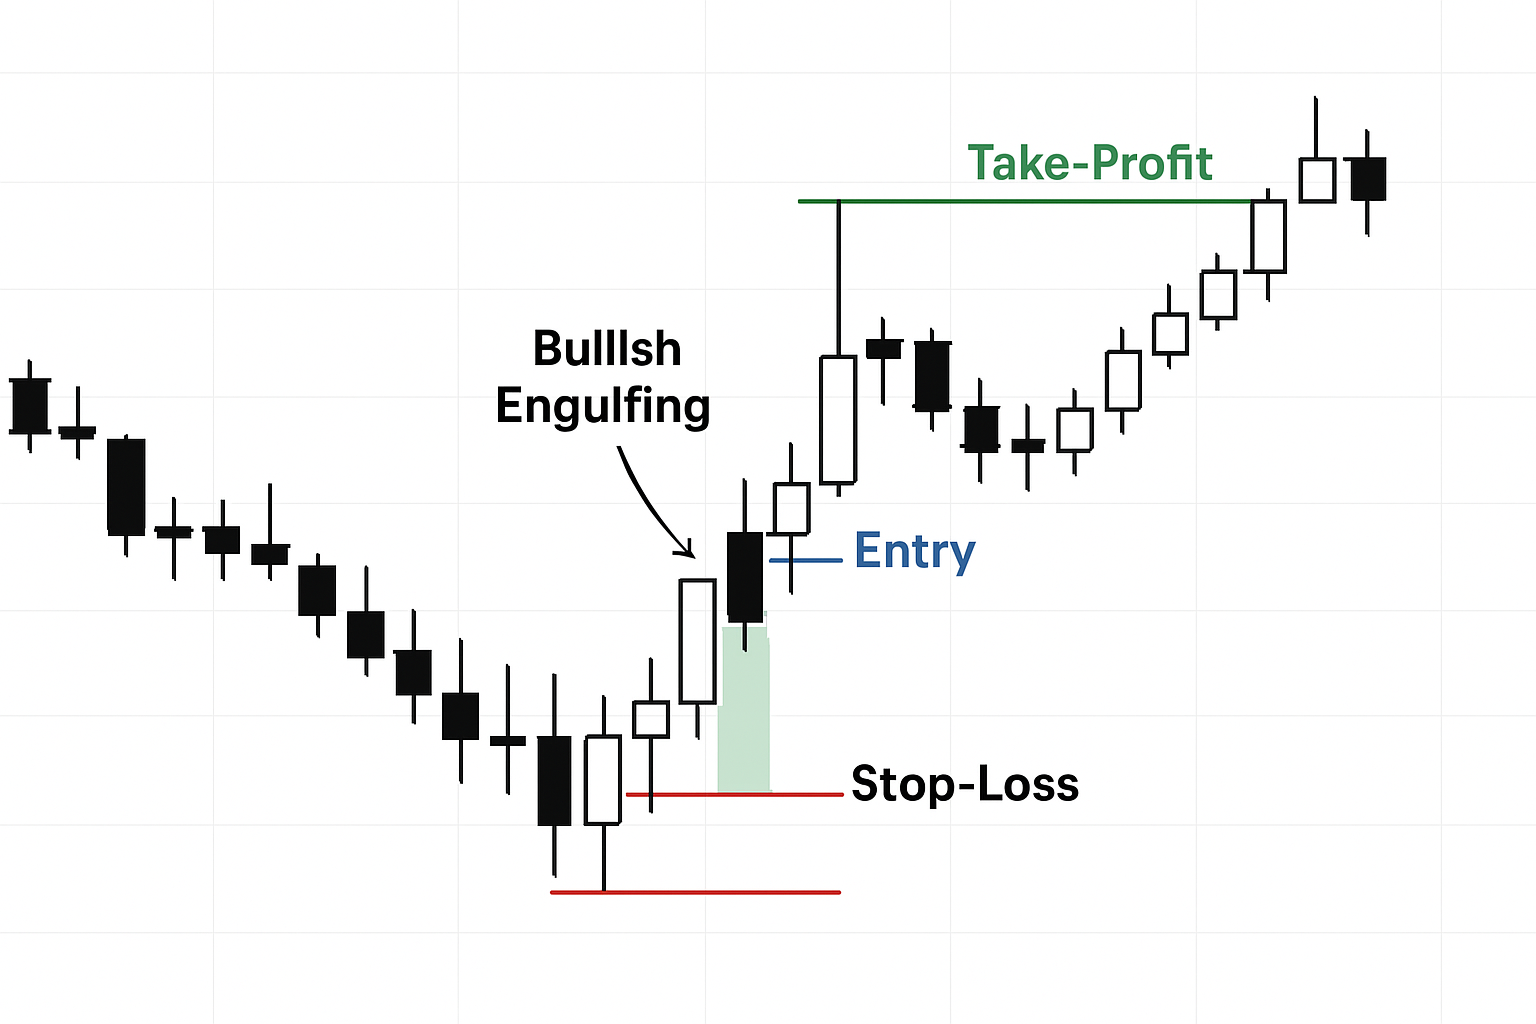
It's crucial to remember that no trading pattern is foolproof. Always use proper risk management techniques and consider the broader market context when trading Bullish Engulfing patterns.
What is a Bearish Engulfing Pattern?
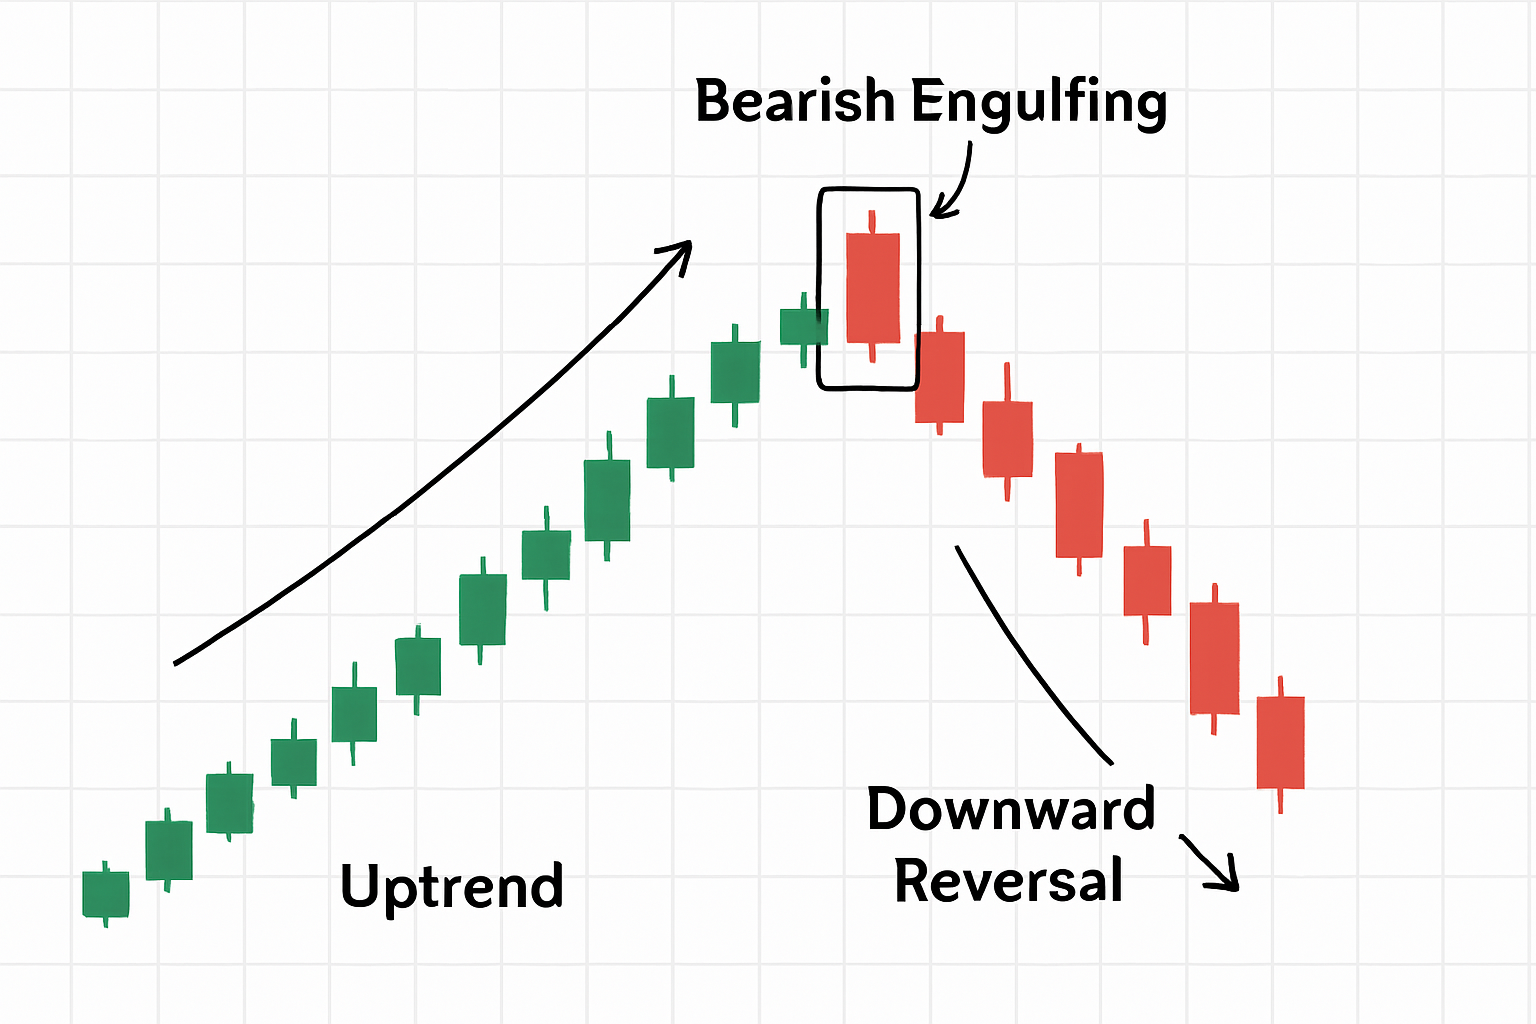
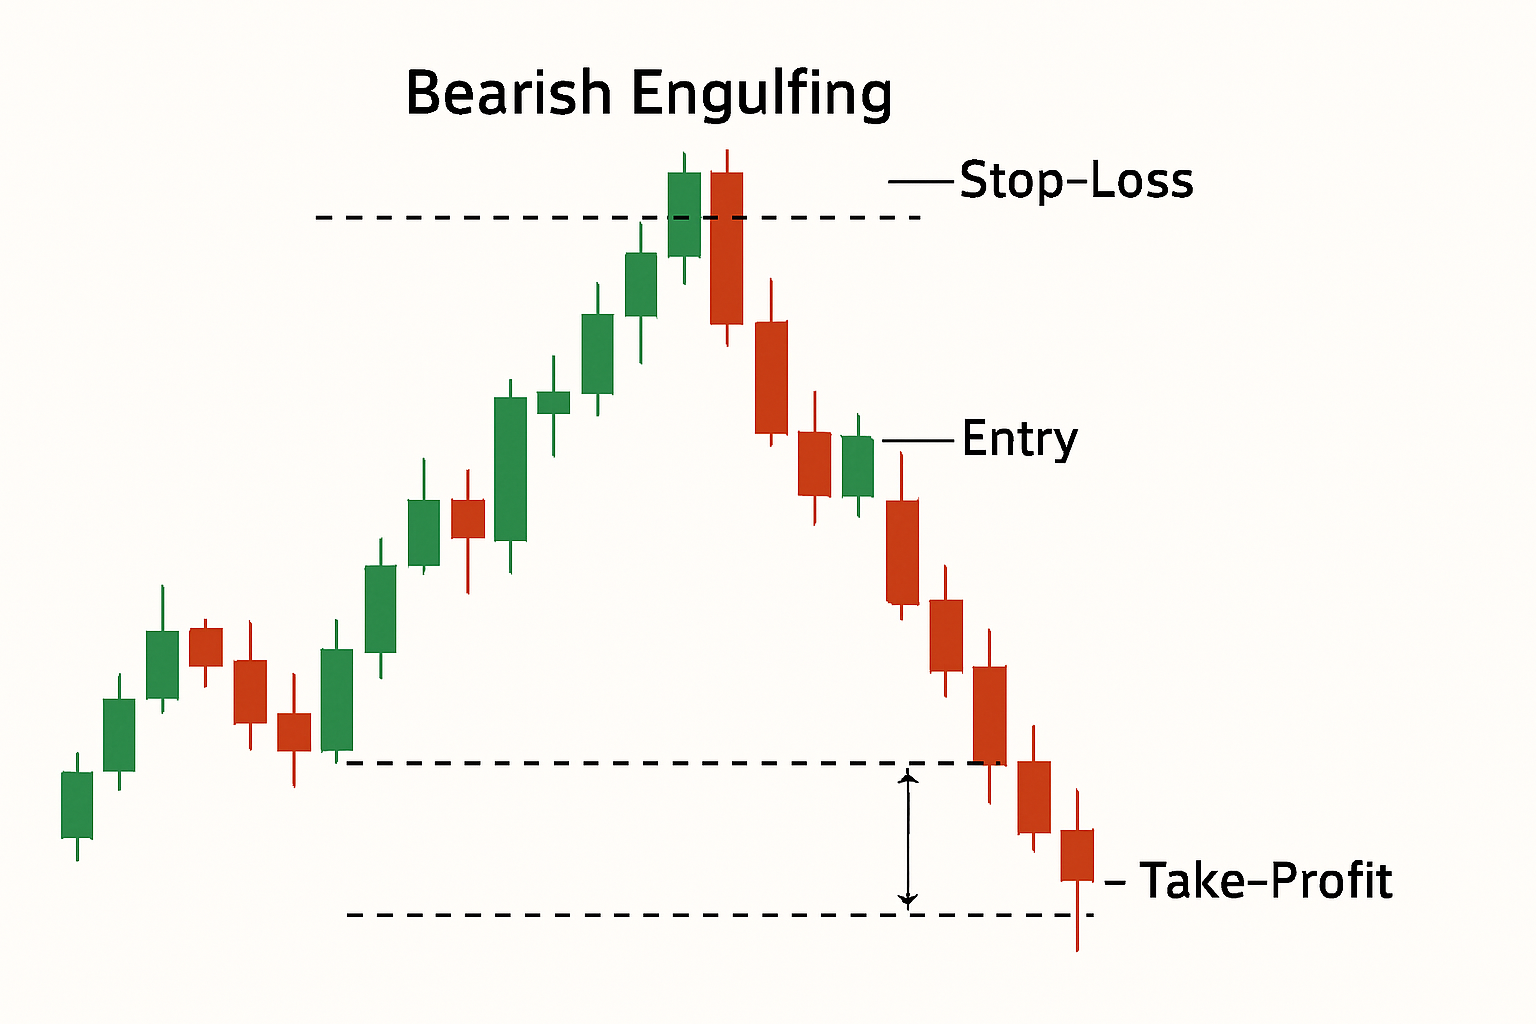
A Bearish Engulfing pattern is a strong top reversal signal that typically appears after an uptrend. It is the counterpart to the Bullish Engulfing pattern and signals that selling pressure has overcome buying pressure. This pattern also consists of two candles: the first is a bullish (or white/green) candle, reflecting the ongoing buying momentum. The second candle is a bearish (or black/red) candle whose real body completely "engulfs" the real body of the first candle. This means the second candle opens higher than the first candle's close and closes lower than the first candle's open. The engulfing nature of the bearish second candle indicates a significant shift in market sentiment, where sellers have decisively taken control from buyers, suggesting a potential reversal from an uptrend to a downtrend. The larger the bearish engulfing candle, the more significant the potential reversal is considered.
How to Identify a Bearish Engulfing Pattern
Identifying a Bearish Engulfing pattern involves looking for specific candlestick characteristics at the peak of an uptrend. Here's what to watch for:
- Established Uptrend: The pattern must appear after a clear and sustained uptrend. Its predictive power is reduced if it forms in a choppy or range-bound market.
- First Candle: The first candle in the pattern must be a bullish candle, continuing the prevailing uptrend.
- Second Candle: The second candle must be a bearish candle.
- Engulfing Body: The body of the second (bearish) candle must completely engulf the body of the first (bullish) candle. This means the open of the second candle is higher than the close of the first, and the close of the second candle is lower than the open of the first. While the wicks of the first candle don't strictly need to be engulfed, a complete engulfment of the entire previous candle (body and wicks) is often seen as a stronger signal by many traders.
- Confirmation (Optional but Recommended): Confirmation can strengthen the signal. This might come from the next candle closing below the low of the engulfing candle, a surge in volume on the day the engulfing pattern forms, or other bearish indications from technical indicators.
How to Trade a Bearish Engulfing Pattern
Trading the Bearish Engulfing pattern involves identifying a potential short-selling opportunity after the pattern forms, coupled with prudent risk management. A common trading approach includes:
- Entry: Traders often look to enter a short position slightly below the low of the second (engulfing) candle. This acts as a confirmation that the bearish momentum is likely to continue. More aggressive traders might consider entering near the close of the engulfing candle, but this approach involves higher risk.
- Stop-Loss: A stop-loss order is crucial and is typically placed above the high of the engulfing candle. Some traders might opt to place it above the high of the first candle if it provides a more conservative risk level. This protects against significant losses if the pattern fails and the price reverses upwards.
- Take-Profit: Take-profit targets can be determined by identifying previous support levels, using Fibonacci retracement or extension levels, or by aiming for a specific risk-to-reward ratio (e.g., 1:2 or 1:3). A clear exit plan for profits is as important as the entry and stop-loss strategy.
- Confluence: The reliability of a Bearish Engulfing pattern is enhanced when it forms in confluence with other bearish signals. These can include resistance levels, bearish divergences on momentum oscillators (like RSI or MACD), or a noticeable increase in trading volume during the formation of the engulfing candle, which suggests strong selling conviction.
As with all chart patterns, the Bearish Engulfing pattern is not infallible. It should be used as part of a comprehensive trading strategy that includes risk management and consideration of the overall market conditions.
The Importance of Volume Confirmation
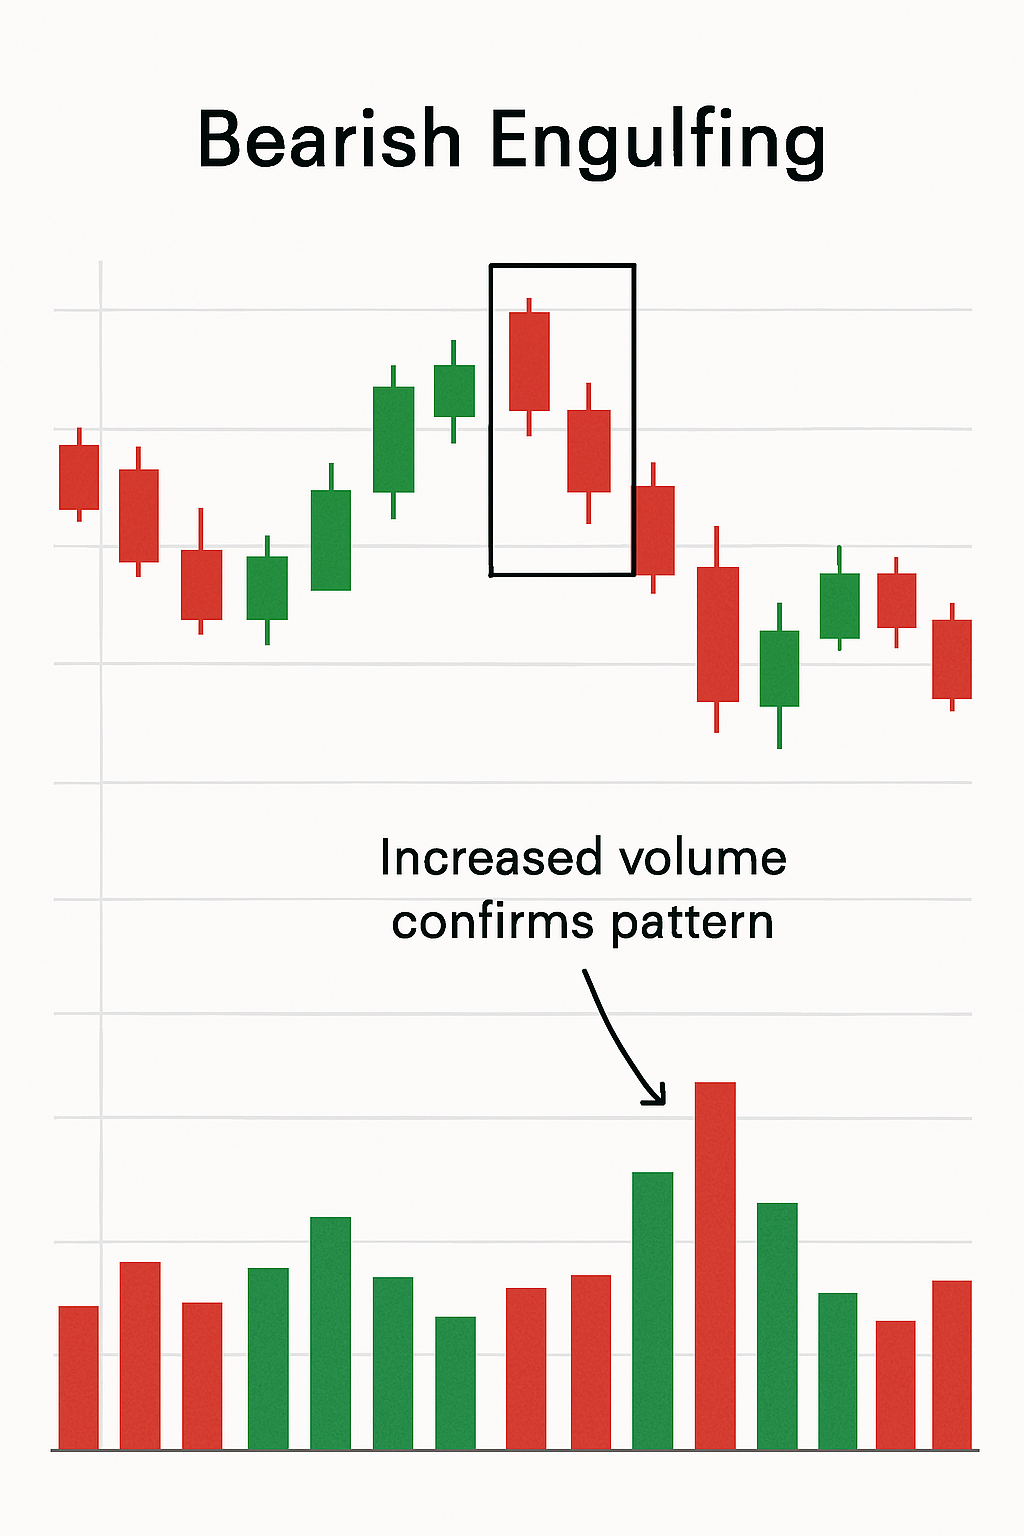
While Engulfing patterns are powerful on their own, their reliability can be significantly increased when confirmed by trading volume. High volume during the formation of the engulfing candle (the second candle in the pattern) suggests strong conviction behind the move and increases the probability of a sustained reversal.
- For a Bullish Engulfing Pattern: A surge in volume on the day the bullish engulfing candle forms indicates strong buying interest. This suggests that many market participants are stepping in to buy, overpowering the sellers and potentially marking the beginning of an uptrend.
- For a Bearish Engulfing Pattern: Similarly, high volume accompanying the bearish engulfing candle signifies strong selling pressure. This implies that sellers are aggressively entering the market, overwhelming the buyers and potentially initiating a downtrend.
Traders often look at a volume chart alongside the price chart to assess the strength of an Engulfing pattern. A pattern that forms on low volume might be less reliable and could be a false signal.
FAQ
What is the main difference between a Bullish and Bearish Engulfing pattern? The main difference lies in their location and implication. A Bullish Engulfing appears after a downtrend and signals a potential upward reversal, with a large bullish candle engulfing a smaller bearish one. A Bearish Engulfing appears after an uptrend and signals a potential downward reversal, with a large bearish candle engulfing a smaller bullish one.
Can Engulfing patterns be used in any market? Yes, Engulfing patterns are versatile and can be identified and traded in various financial markets, including stocks, forex, commodities, and cryptocurrencies, as they reflect universal market psychology.
Are Engulfing patterns reliable on all timeframes? Engulfing patterns can appear on all timeframes, from intraday charts to daily, weekly, and monthly charts. However, patterns on higher timeframes (like daily or weekly) are generally considered more reliable and carry more significance than those on very short timeframes, which can be prone to market noise.