How to Identify and Trade Hammer (Pin Bar) and Shooting Star Candlestick Patterns
The Hammer and Shooting Star candlestick patterns, also known as Pin Bars, are among the most reliable and widely recognized signals in technical analysis. These single-candle patterns can indicate potential trend reversals, providing traders with valuable entry and exit points. Understanding their formation and implications is crucial for effective trading.
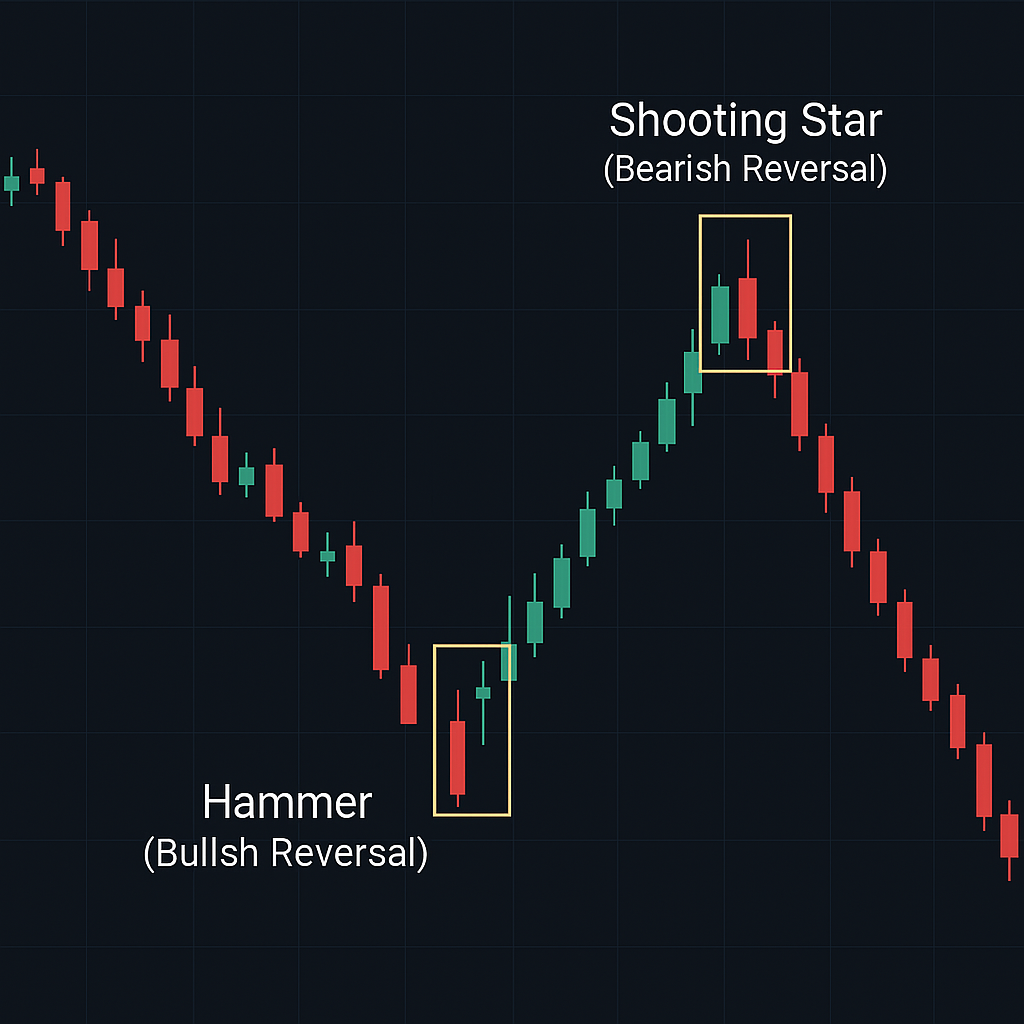
What are Hammer and Shooting Star (Pin Bar) Candlestick Patterns?
Hammer and Shooting Star patterns are characterized by their small real bodies and long shadows (wicks), which must be at least twice the length of the body. The position of the small body and the direction of the long shadow differentiate them and signify their potential impact on price direction. The color of the real body is less important than the overall shape and context in which the pattern appears, though a body color that aligns with the reversal (green/white for Hammer, red/black for Shooting Star) can strengthen the signal.
The Hammer (Bullish Pin Bar)
A Hammer is a bullish reversal pattern that typically appears at the bottom of a downtrend. Its structure consists of a small real body at the upper end of the trading range with a long lower shadow and little to no upper shadow. This formation indicates that sellers initially pushed prices significantly lower, but buyers stepped in with force, driving prices back up to close near the opening level. This shift in momentum suggests that the selling pressure is waning and a potential upward reversal is imminent.
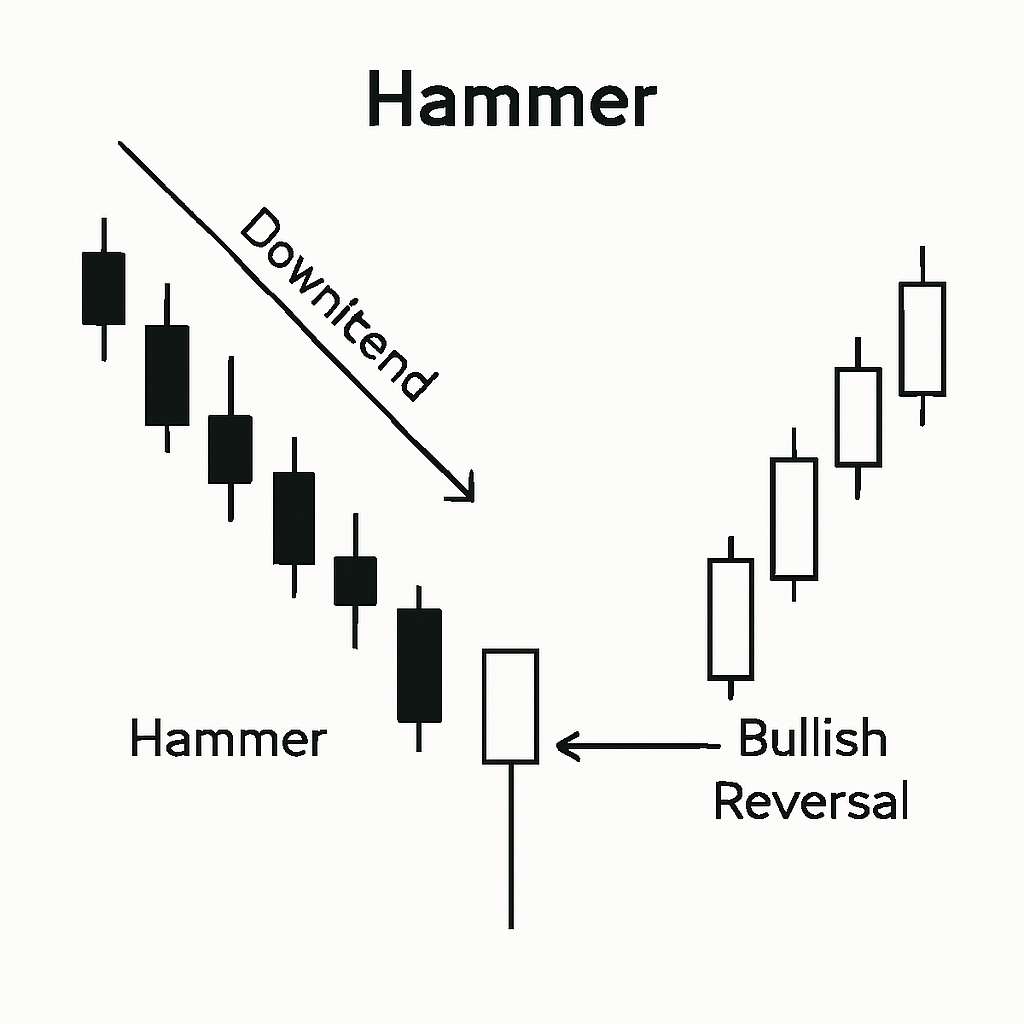
The Shooting Star (Bearish Pin Bar)
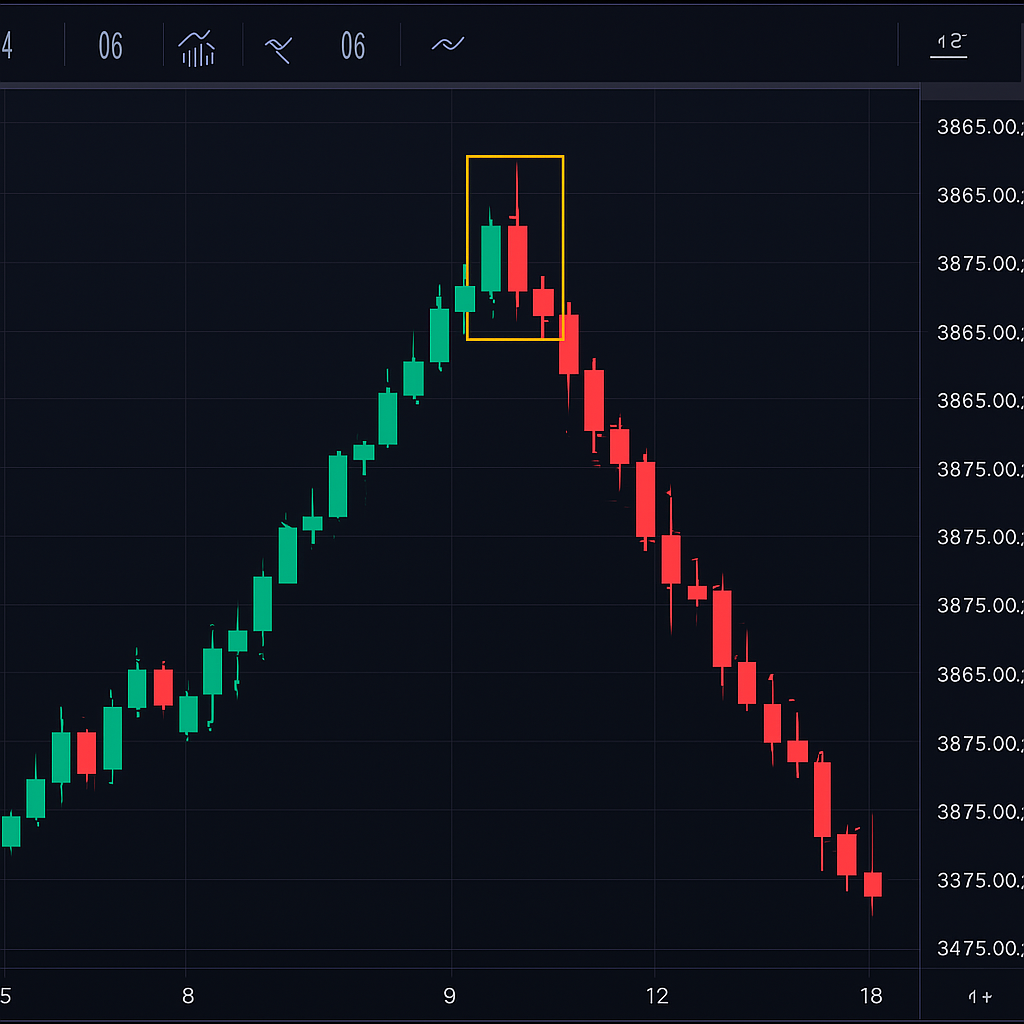
Conversely, a Shooting Star is a bearish reversal pattern that usually forms at the peak of an uptrend. It features a small real body at the lower end of the trading range, a long upper shadow, and little or no lower shadow. This pattern signifies that buyers initially pushed prices substantially higher, but sellers then took control, forcing prices back down to close near the open. This indicates that the buying momentum is fading and a potential downward reversal may occur.
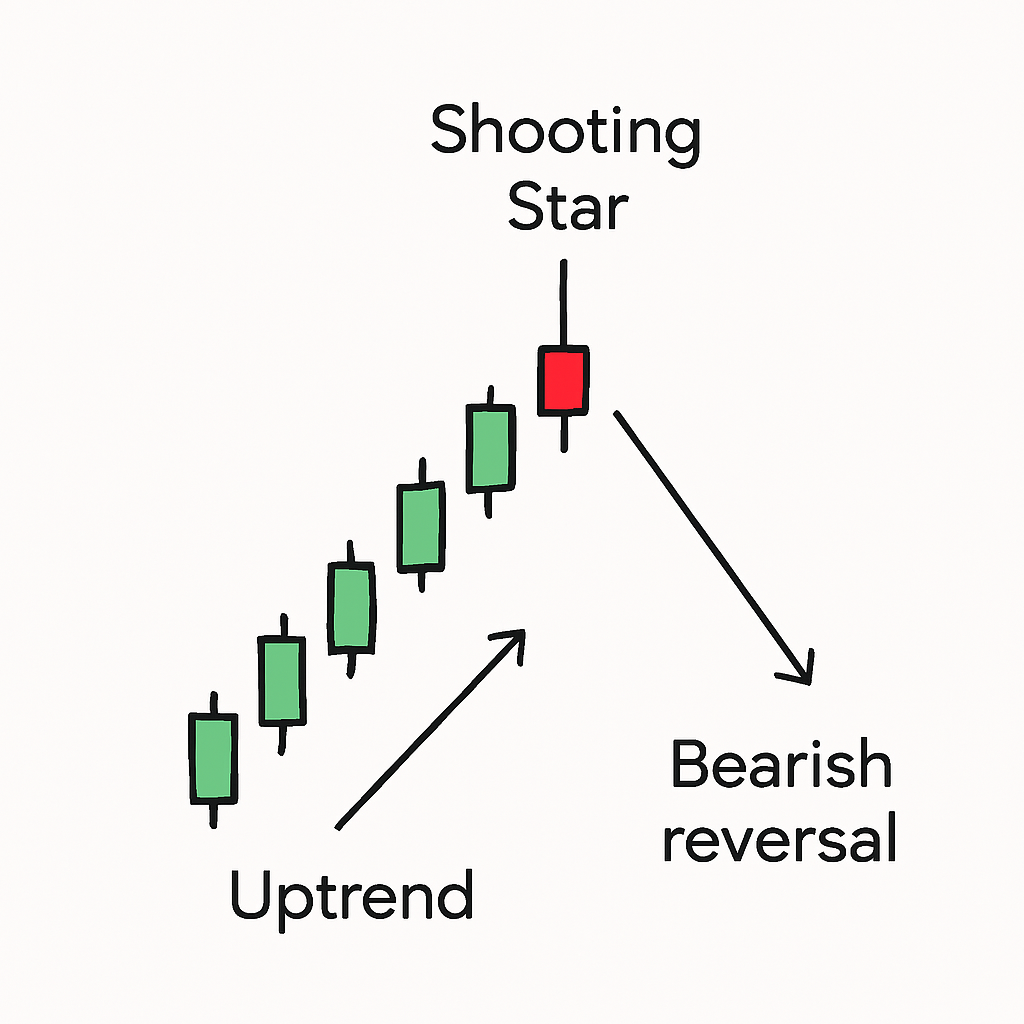
How to Identify Hammer and Shooting Star Patterns
Identifying these patterns requires careful observation of candlestick characteristics within the broader market context. Key features to look for include:
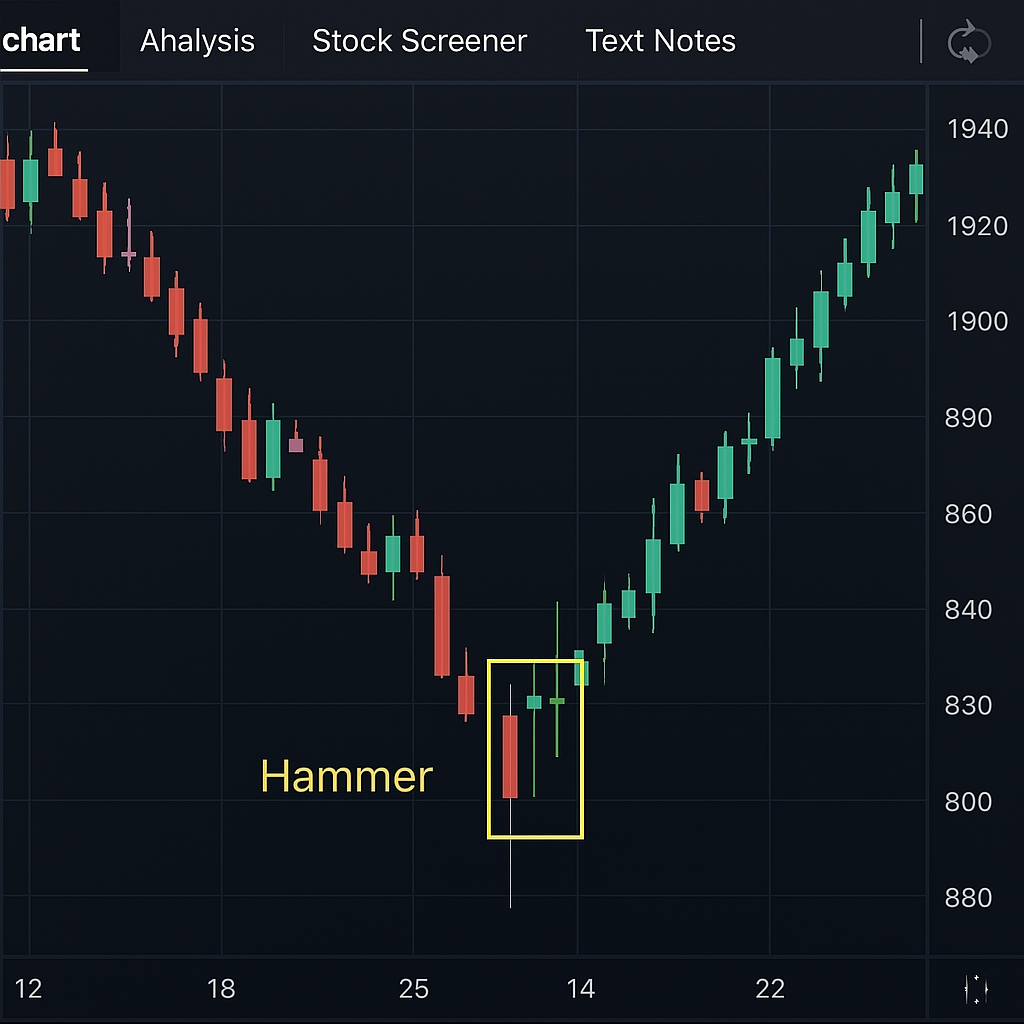
For a Hammer (Bullish Pin Bar):
- Preceding Trend: The pattern must appear after a discernible downtrend.
- Small Real Body: The body of the candlestick should be small and located at the upper end of the trading range.
- Long Lower Shadow: The lower shadow (wick) must be at least twice the length of the real body. A longer shadow generally indicates a stronger potential reversal.
- Little to No Upper Shadow: The upper shadow should be very short or non-existent.
- Confirmation: Subsequent price action, such as a bullish candle closing above the Hammer's high, can confirm the reversal.
For a Shooting Star (Bearish Pin Bar):
- Preceding Trend: The pattern must form after a clear uptrend.
- Small Real Body: The body of the candlestick should be small and located at the lower end of the trading range.
- Long Upper Shadow: The upper shadow (wick) must be at least twice the length of the real body. A longer shadow often suggests a more significant potential reversal.
- Little to No Lower Shadow: The lower shadow should be very short or non-existent.
- Confirmation: Subsequent price action, such as a bearish candle closing below the Shooting Star's low, can confirm the reversal.
How to Trade Hammer and Shooting Star Patterns
Trading Hammer and Shooting Star patterns involves more than just identifying them; it requires a strategic approach that incorporates confirmation, risk management, and an understanding of market context.
Trading the Hammer (Bullish Reversal):
- Entry: A common entry strategy is to place a buy order above the high of the Hammer candle once it has closed. More conservative traders might wait for the next candle to close above the Hammer's high as confirmation.
- Stop-Loss: A stop-loss order is typically placed below the low of the Hammer's long shadow. This minimizes potential losses if the reversal fails.
- Profit Target: Profit targets can be set based on previous resistance levels, Fibonacci retracement levels, or a predetermined risk-reward ratio.
- Volume: Higher volume on the Hammer candle and the confirmation candle can add strength to the bullish signal.
Trading the Shooting Star (Bearish Reversal):
- Entry: Traders often enter a short position below the low of the Shooting Star candle after it closes. Waiting for the next candle to close below the Shooting Star's low provides further confirmation.
- Stop-Loss: A stop-loss order is usually placed above the high of the Shooting Star's long shadow to limit potential losses.
- Profit Target: Profit targets can be identified using previous support levels, Fibonacci extension levels, or a favorable risk-reward ratio.
- Volume: Increased volume during the formation of the Shooting Star and its confirmation candle can reinforce the bearish signal.
It is crucial to remember that no single pattern guarantees success. Hammer and Shooting Star patterns are most effective when used in conjunction with other technical indicators, such as support and resistance levels, trendlines, moving averages, or oscillators like the RSI or MACD. This confluence of signals can significantly improve the probability of a successful trade.
FAQ
Can you trade Hammer or Shooting Star patterns by themselves? No, it's not advisable. These patterns are stronger when used in confluence with other technical indicators and analysis as part of a comprehensive trading strategy.
Can you trade Hammer and Shooting Star patterns in any market? Yes, these patterns can be found and traded in various financial markets, including stocks, forex, commodities, and cryptocurrencies, as they reflect universal market psychology.
Can you trade Hammer and Shooting Star patterns in any timeframe? Yes, Hammer and Shooting Star patterns can appear on any timeframe, from intraday charts to daily, weekly, or monthly charts, though their reliability may vary.