Shark 32 Candlestick Pattern Explained
What is the Shark 32 Candlestick Pattern?
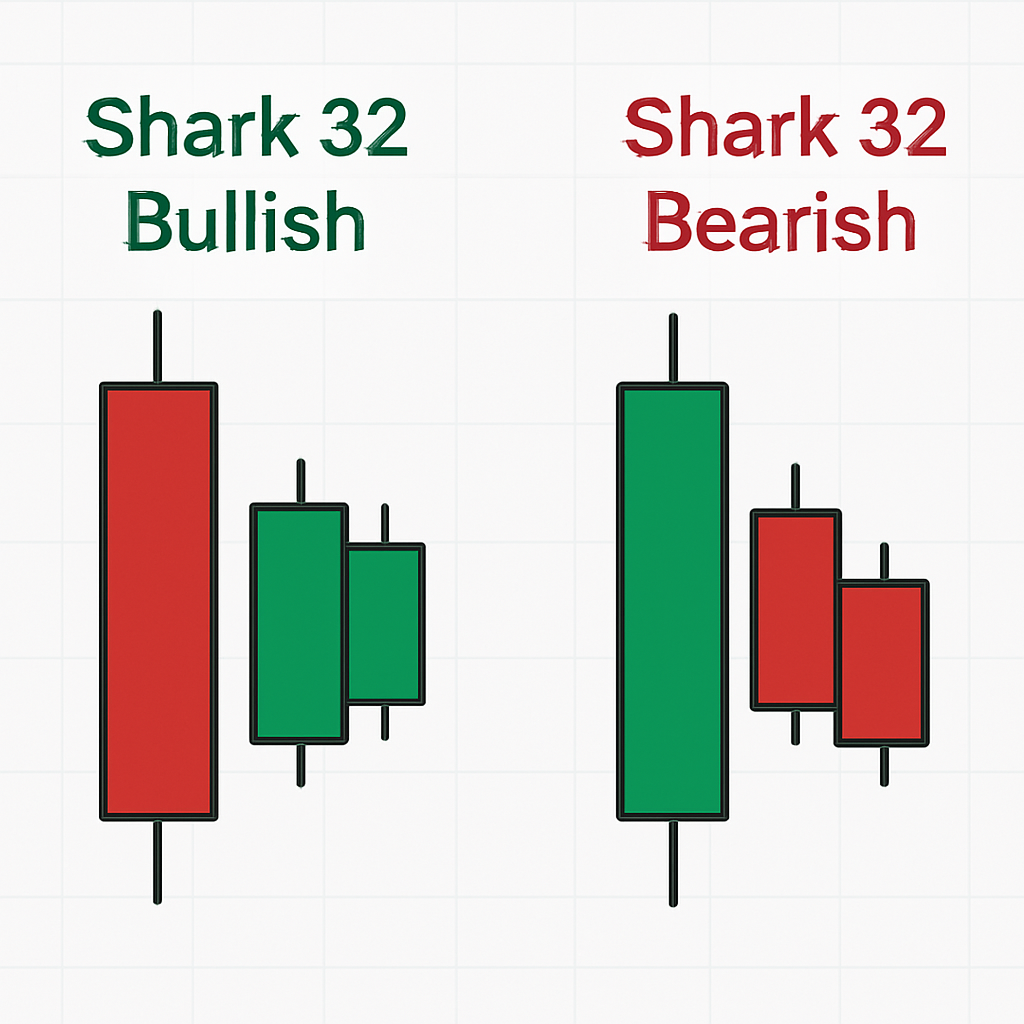
The Shark 32 candlestick pattern is a three-bar formation that signals potential short-term price reversals or continuations, depending on the preceding trend and overall market context. It is characterized by an initial bar, often referred to as the "mother bar" or "setup bar," followed by two smaller bars, known as "inside bars." These inside bars must have their entire range (high to low) contained within the range of the initial setup bar. The pattern's name, "Shark 32," is derived from its visual appearance and the specific sequence of these three candles.
This pattern is considered versatile as it can appear in both uptrends and downtrends, potentially indicating either a bullish or bearish outcome. The key to interpreting the Shark 32 lies in its structure: the first bar establishes a significant price range, and the subsequent two inside bars represent a period of consolidation or indecision within that range. A breakout from this consolidation, typically above the high or below the low of the initial setup bar, is often used as a trading signal. Traders look for this pattern to identify moments where the market is pausing before making its next significant move, offering opportunities for entry with relatively defined risk levels.
How to identify the Shark 32 Candlestick Pattern?
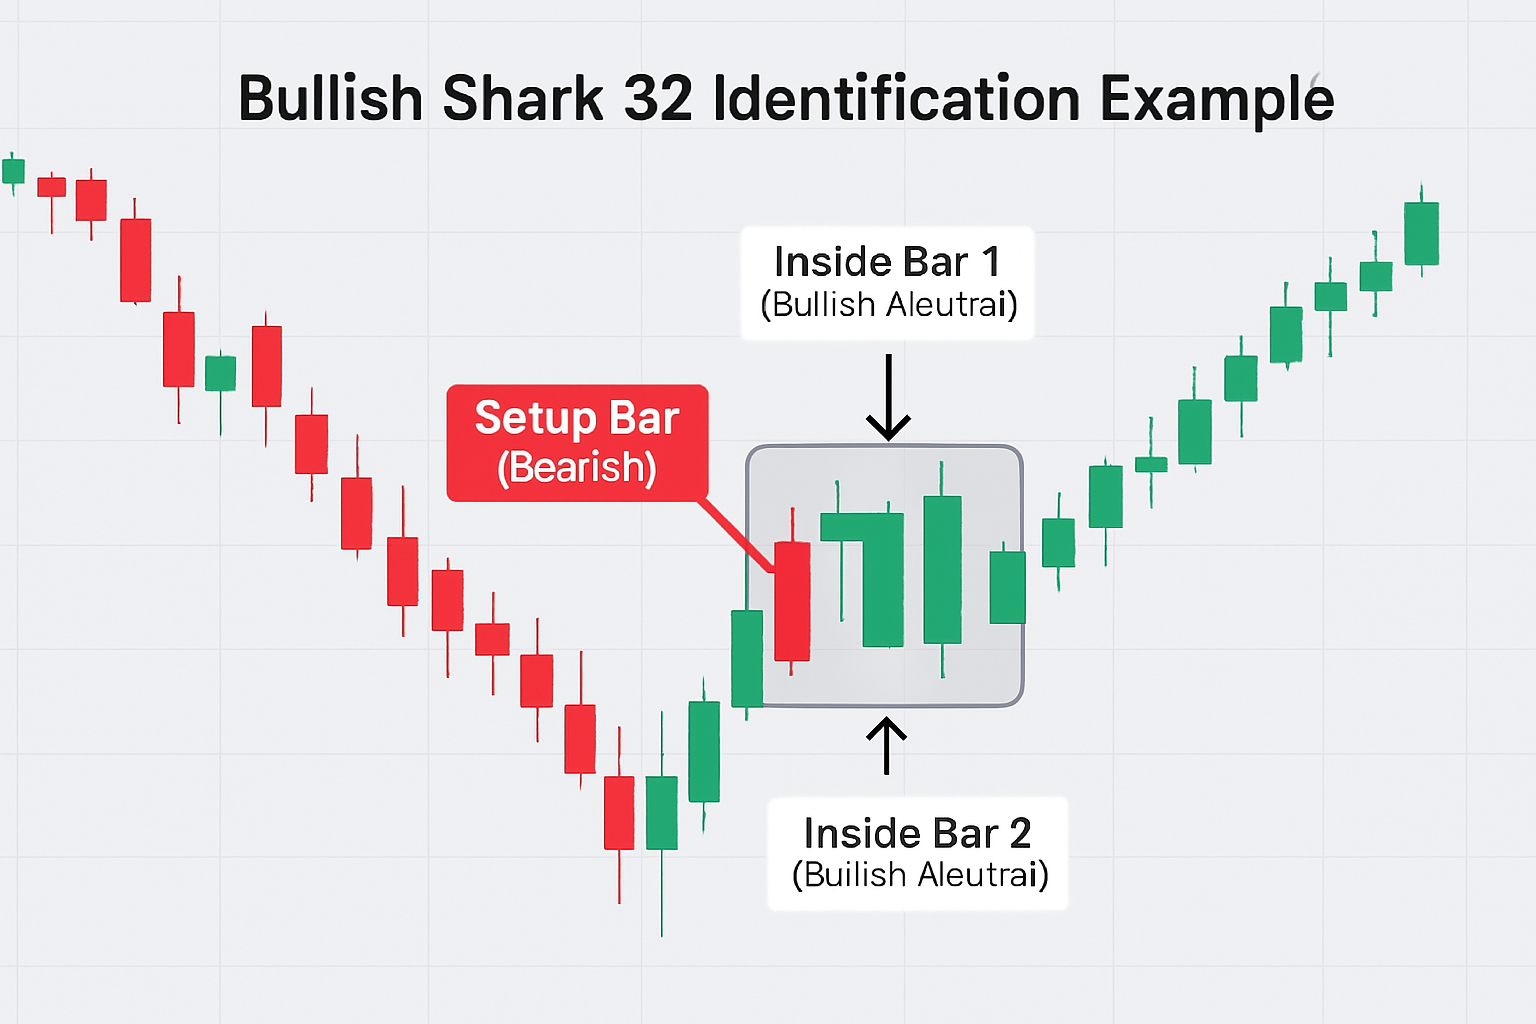
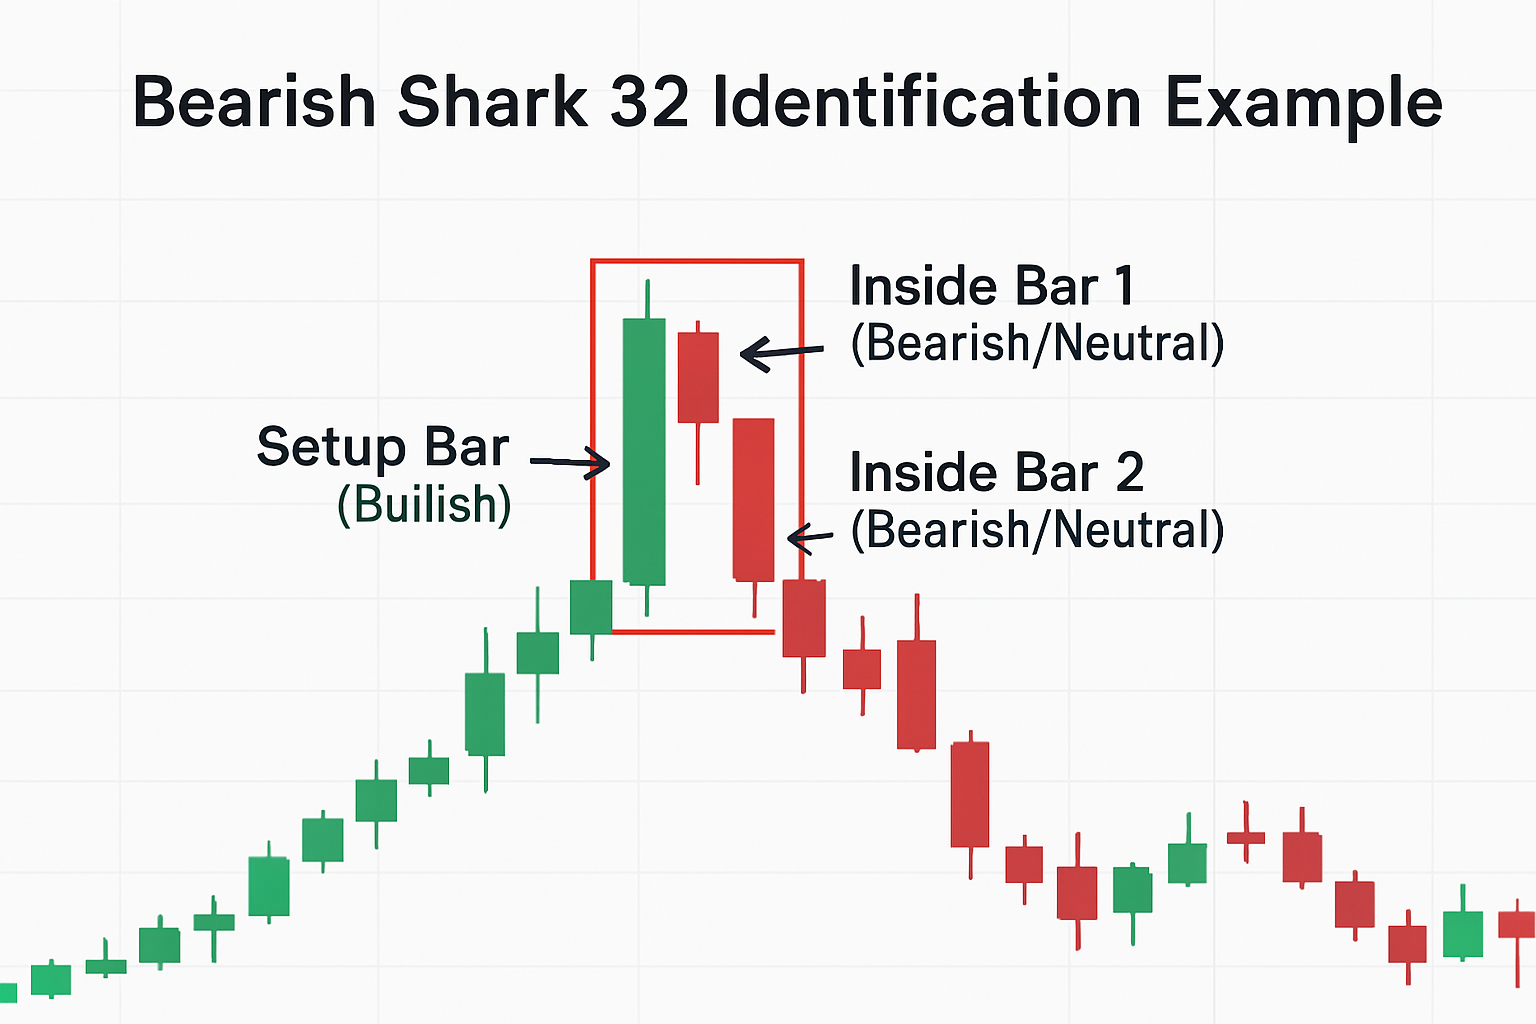
Identifying the Shark 32 candlestick pattern involves a systematic check of a three-bar sequence on a price chart. The pattern can manifest in both bullish and bearish contexts, but its core structure remains consistent. The first step is to locate an initial, relatively large candlestick, often referred to as the "setup bar" or "mother bar." This bar establishes the primary trading range for the pattern. The size of this bar is significant because it indicates a period of strong momentum or volatility that sets the stage for the subsequent consolidation.
Following the setup bar, the next two candlesticks must be "inside bars." An inside bar is characterized by having its high below the high of the preceding bar and its low above the low of the preceding bar. In the Shark 32 pattern, both the second and third bars must be inside bars relative to the first setup bar. This means that the entire price range (high to low) of the second bar must be contained within the high-low range of the first bar, and similarly, the entire price range of the third bar must also be contained within the high-low range of the first bar. It is crucial that these two subsequent bars are noticeably smaller than the initial setup bar, visually representing a contraction in volatility and a period of indecision in the market.
For a bullish Shark 32 pattern, the setup typically occurs after a downtrend or during a pullback in an uptrend. The first bar is often a bearish candle (closing lower than it opened), reflecting the prevailing selling pressure. However, the two subsequent inside bars are usually bullish (closing higher than they opened) or neutral (doji or spinning tops), indicating that the selling momentum is waning and buyers might be stepping in. The key is that these two smaller bars are unable to make new lows below the low of the setup bar, suggesting a potential bottoming or a pause before a move higher.
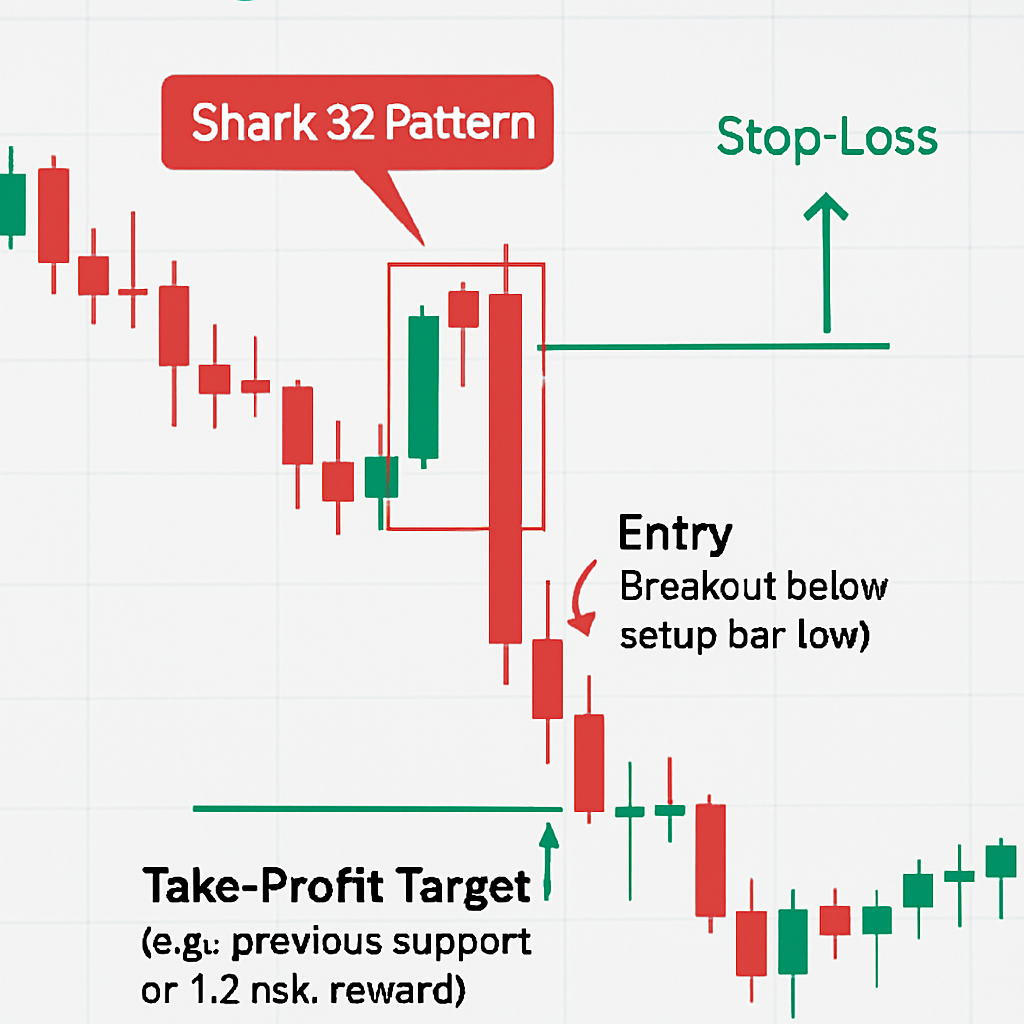
Conversely, for a bearish Shark 32 pattern, the setup usually forms after an uptrend or during a rally in a downtrend. The first bar is often a bullish candle (closing higher than it opened), reflecting the buying pressure. The two subsequent inside bars are typically bearish (closing lower than they opened) or neutral, signaling that the buying momentum is fading and sellers might be gaining control. These two smaller bars fail to make new highs above the high of the setup bar, suggesting a potential topping formation or a pause before a move lower. The clear visual cue is the large initial bar followed by two progressively smaller bars huddled within its range, creating a distinct visual footprint on the chart.
How to trade the Shark 32 Candlestick Pattern?
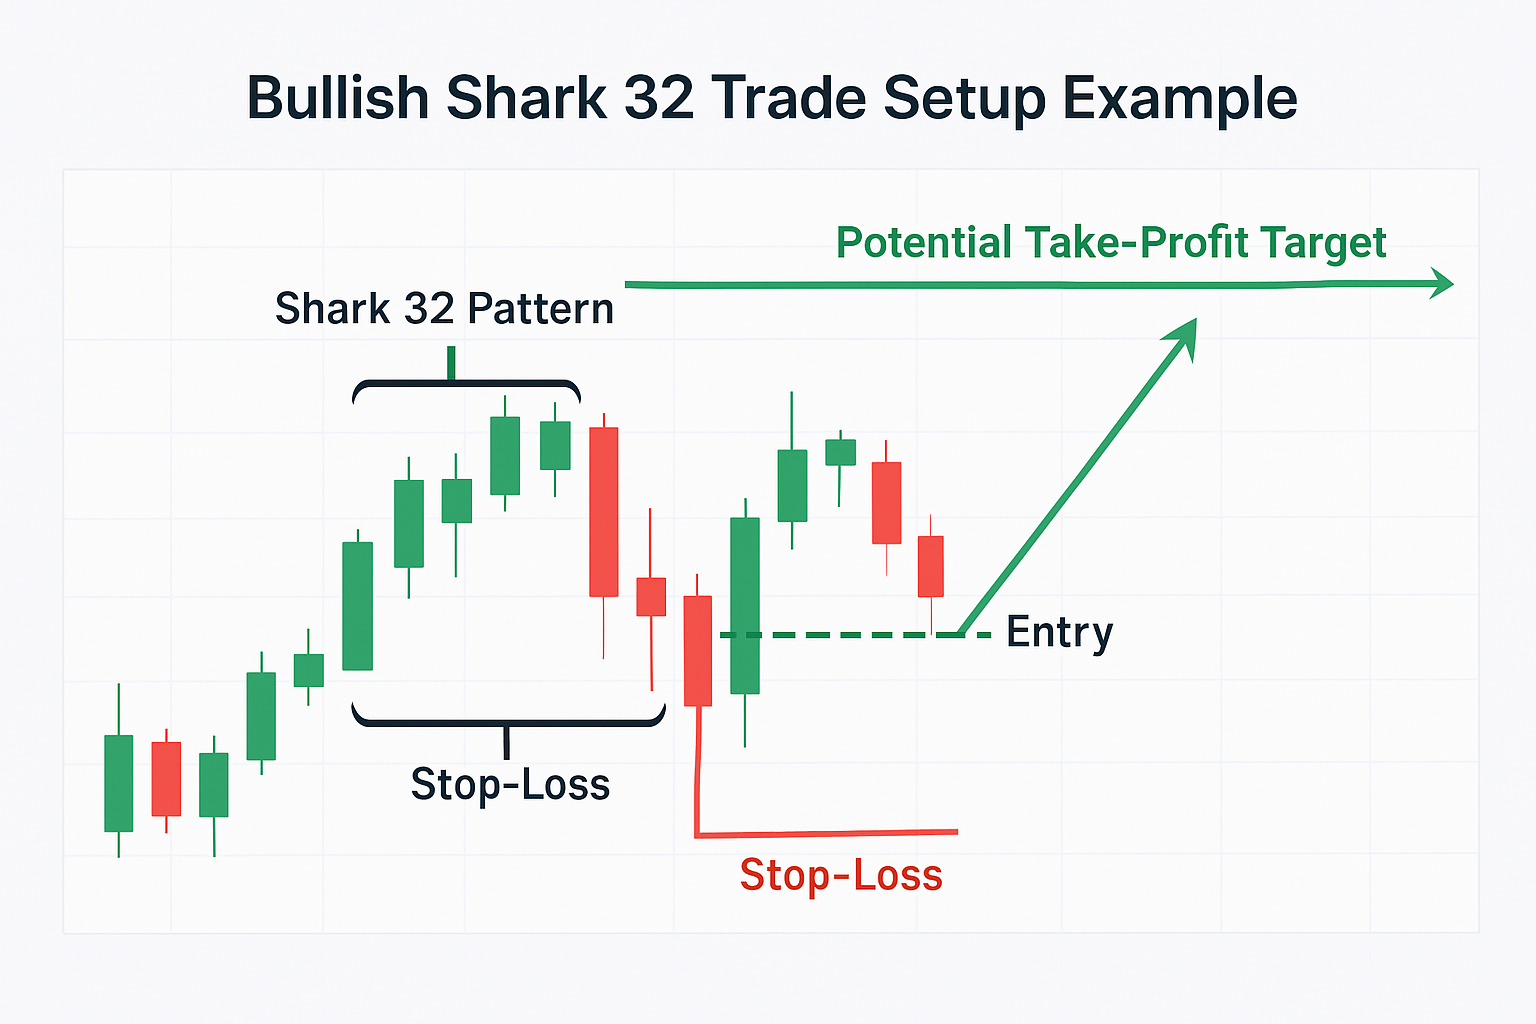
Trading the Shark 32 candlestick pattern effectively involves a clear strategy for entry, stop-loss placement, and take-profit targets, considering both bullish and bearish scenarios. Once the pattern is correctly identified, traders typically wait for a confirmation breakout before entering a position. This breakout is usually defined as the price moving beyond the high or low of the initial setup bar.
For a bullish Shark 32 pattern, the entry signal often occurs when the price breaks and closes above the high of the first (setup) bar. This breakout suggests that the period of consolidation represented by the two inside bars has resolved to the upside, and the buyers who stepped in during the formation are now taking control. An aggressive entry might be taken as soon as the price pierces the high of the setup bar, while a more conservative approach would wait for a candlestick to close above this level to confirm the breakout strength. The stop-loss is commonly placed just below the low of the setup bar, or alternatively, below the low of the entire three-bar pattern if it provides a tighter risk point. This placement ensures that if the pattern fails and the price reverses, the loss is contained. Take-profit targets can be determined using various methods, such as a fixed risk-reward ratio (e.g., 1:2 or 1:3), targeting previous swing highs or significant resistance levels, or using trailing stops to capture a larger portion of the ensuing upward move.
For a bearish Shark 32 pattern, the entry signal is typically triggered when the price breaks and closes below the low of the first (setup) bar. This indicates that the consolidation has resolved to the downside, and sellers are now dominating. Similar to the bullish setup, an aggressive entry could be taken on the break of the setup bar's low, while a conservative entry would wait for a close below this level. The stop-loss is usually placed just above the high of the setup bar, or above the high of the entire three-bar pattern. This protects the trader if the bearish signal proves false and the price rallies. Take-profit targets for a bearish trade can be set by aiming for previous swing lows or significant support levels, employing a fixed risk-reward ratio, or using a trailing stop to maximize profit from the downward move. It is also crucial to consider the broader market context, such as the prevailing trend and nearby support or resistance zones, as these can influence the probability of success for any Shark 32 pattern trade.
FAQ
What is the Shark 32 Candlestick Pattern? The Shark 32 is a three-bar pattern. An initial large bar is followed by two smaller inside bars, signaling potential consolidation before a price move. It can be bullish or bearish.
Can you trade the Shark 32 pattern by itself? No, it's best used with other indicators or analysis. The Shark 32 signals potential, but confluence with your broader trading strategy increases reliability for entries and exits.
Can you trade the Shark 32 pattern in any market? Yes, the Shark 32 pattern can appear in any market, including forex, stocks, and commodities. Its principles of consolidation and breakout are universally applicable across different asset classes.