Bat Harmonic Pattern: Precision Trading with Fibonacci Ratios
The Bat Harmonic Pattern is one of the most accurate and reliable reversal patterns in technical analysis, offering traders precise entry and exit points based on specific Fibonacci measurements.
What is the Bat Harmonic Pattern?
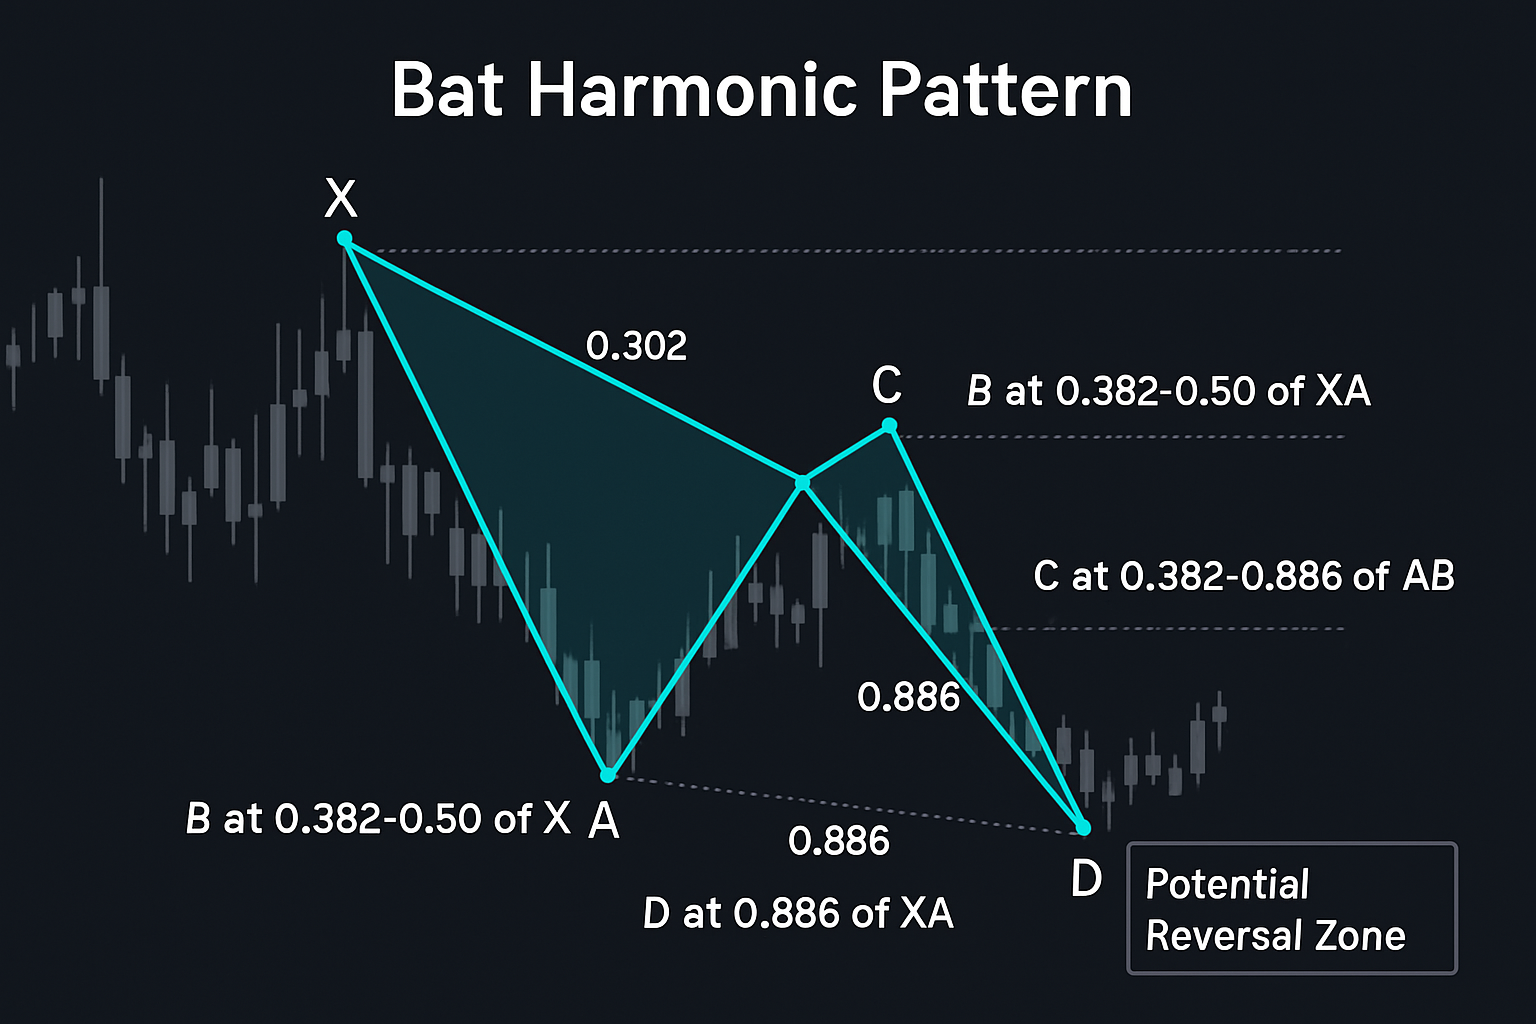
The Bat Harmonic Pattern is a five-point reversal pattern discovered by Scott Carney in 2001. It's considered one of the most precise patterns in the harmonic trading arsenal, characterized by specific Fibonacci retracement and extension levels that create a distinct bat-shaped formation on price charts.
The pattern consists of five key points (X, A, B, C, and D) and represents a deep retest of support or resistance that often leads to sharp price reversals. The defining characteristic of the Bat pattern is the 0.886 retracement of the XA leg at point D, which forms the Potential Reversal Zone (PRZ) where traders anticipate a price reversal.
Key Fibonacci Ratios in the Bat Pattern
The Bat pattern's power comes from its precise Fibonacci measurements between points:
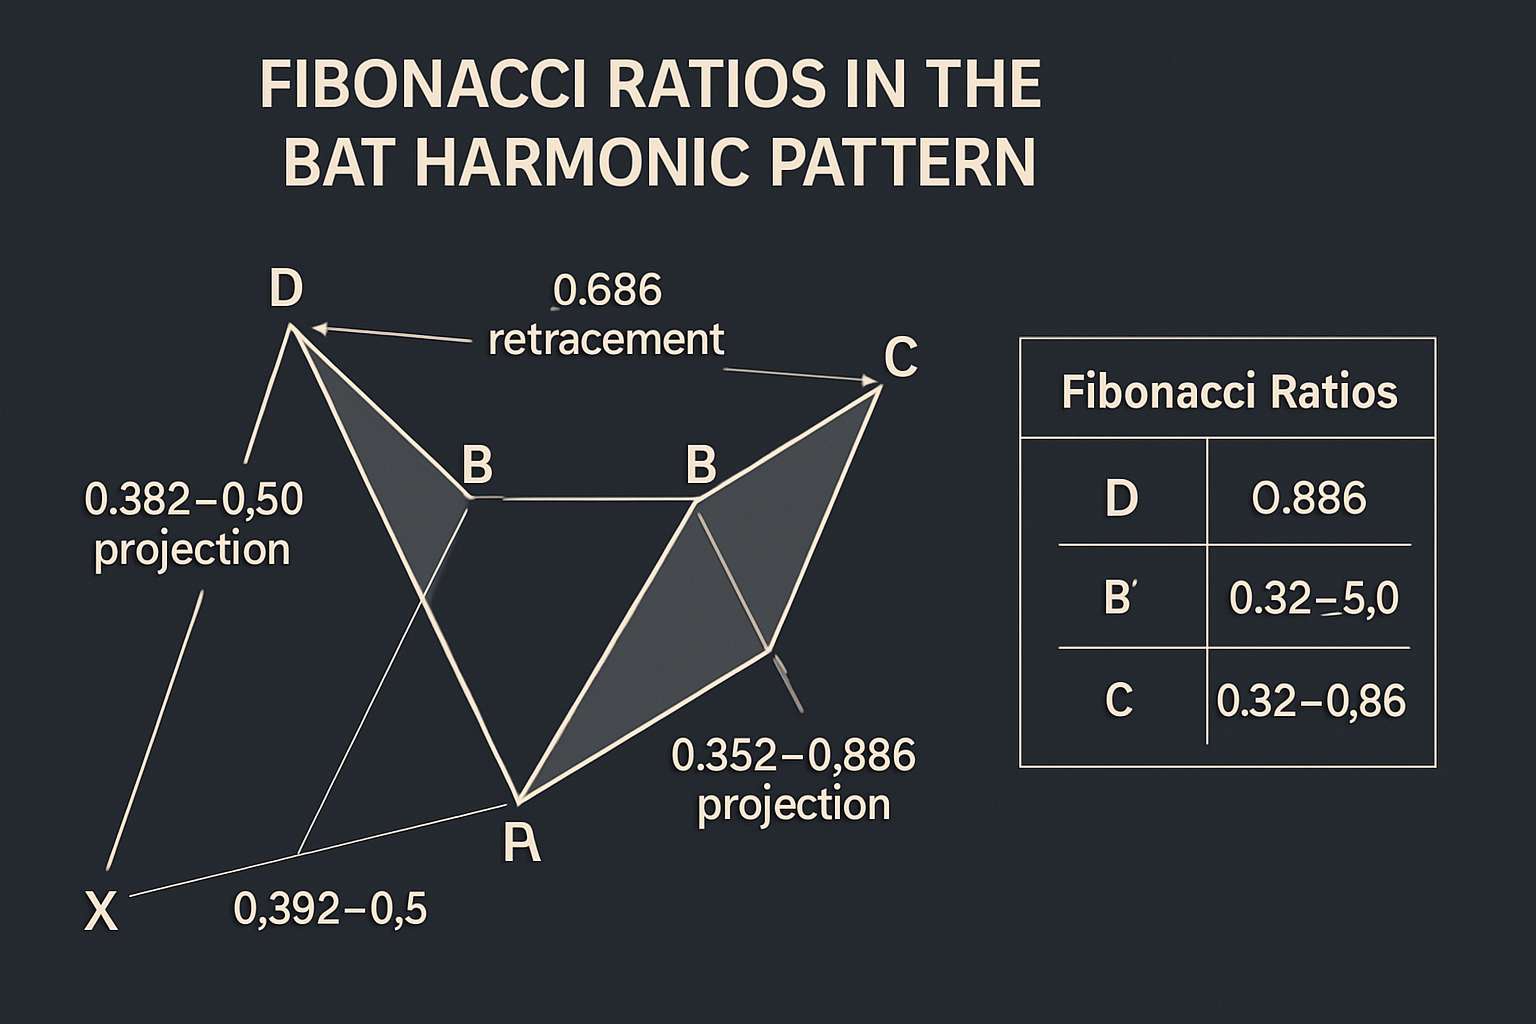
The specific Fibonacci ratios that define a valid Bat pattern are:
- XA: Initial price movement (no specific ratio)
- AB: Retracement of 0.382 to 0.50 of XA
- BC: Extension of 0.382 to 0.886 of AB
- CD: Extension that takes price to D point
- D: 0.886 retracement of XA (the critical PRZ level)
What distinguishes the Bat pattern from other harmonic patterns like the Gartley is primarily the B point retracement (less than 0.618 of XA) and the deeper D point retracement at precisely 0.886 of XA.
Bullish Bat Pattern
The Bullish Bat Pattern forms during a downtrend and signals a potential upward reversal. It begins with a downward price movement from X to A, followed by a retracement to point B, another leg down to point C, and finally a move to point D at the 0.886 retracement of XA.
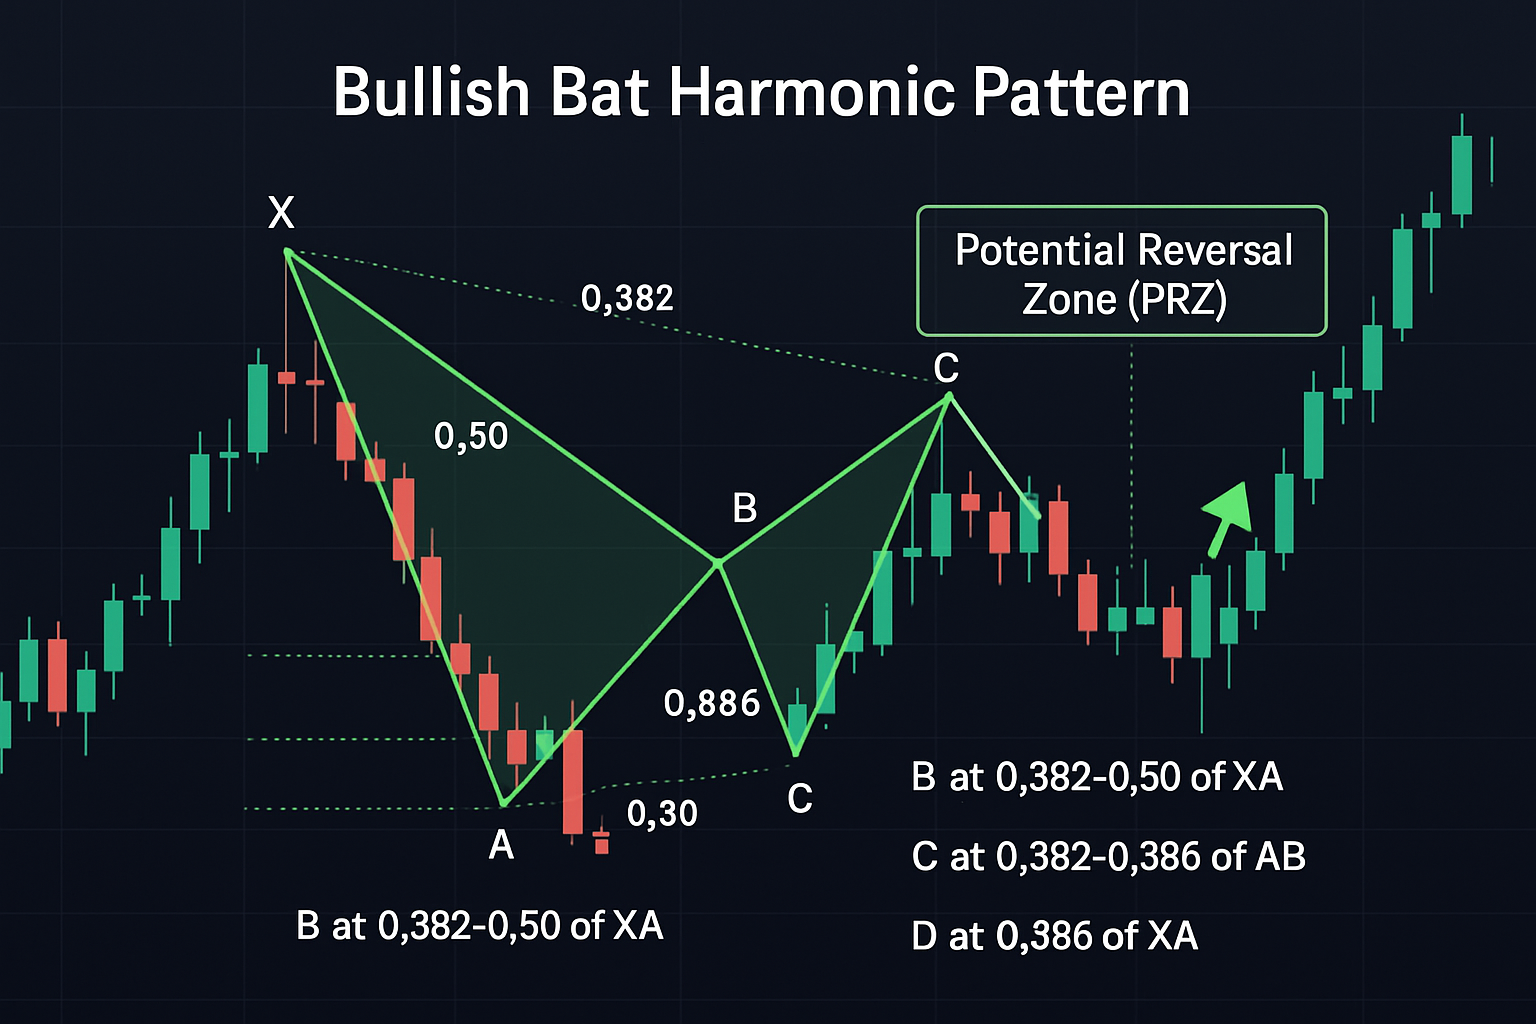
In a bullish Bat pattern:
- The pattern forms after a downtrend
- Point D forms at the 0.886 retracement of XA
- The PRZ at point D represents a buying opportunity
- Traders look for confirmation signals at point D before entering long positions
- Stop losses are typically placed just below the D point
When properly identified, the bullish Bat pattern can signal the end of a downtrend and the beginning of a new uptrend, offering traders a high-probability entry point with a favorable risk-to-reward ratio.
Bearish Bat Pattern
The Bearish Bat Pattern forms during an uptrend and signals a potential downward reversal. It begins with an upward price movement from X to A, followed by a retracement to point B, another leg up to point C, and finally a move to point D at the 0.886 retracement of XA.
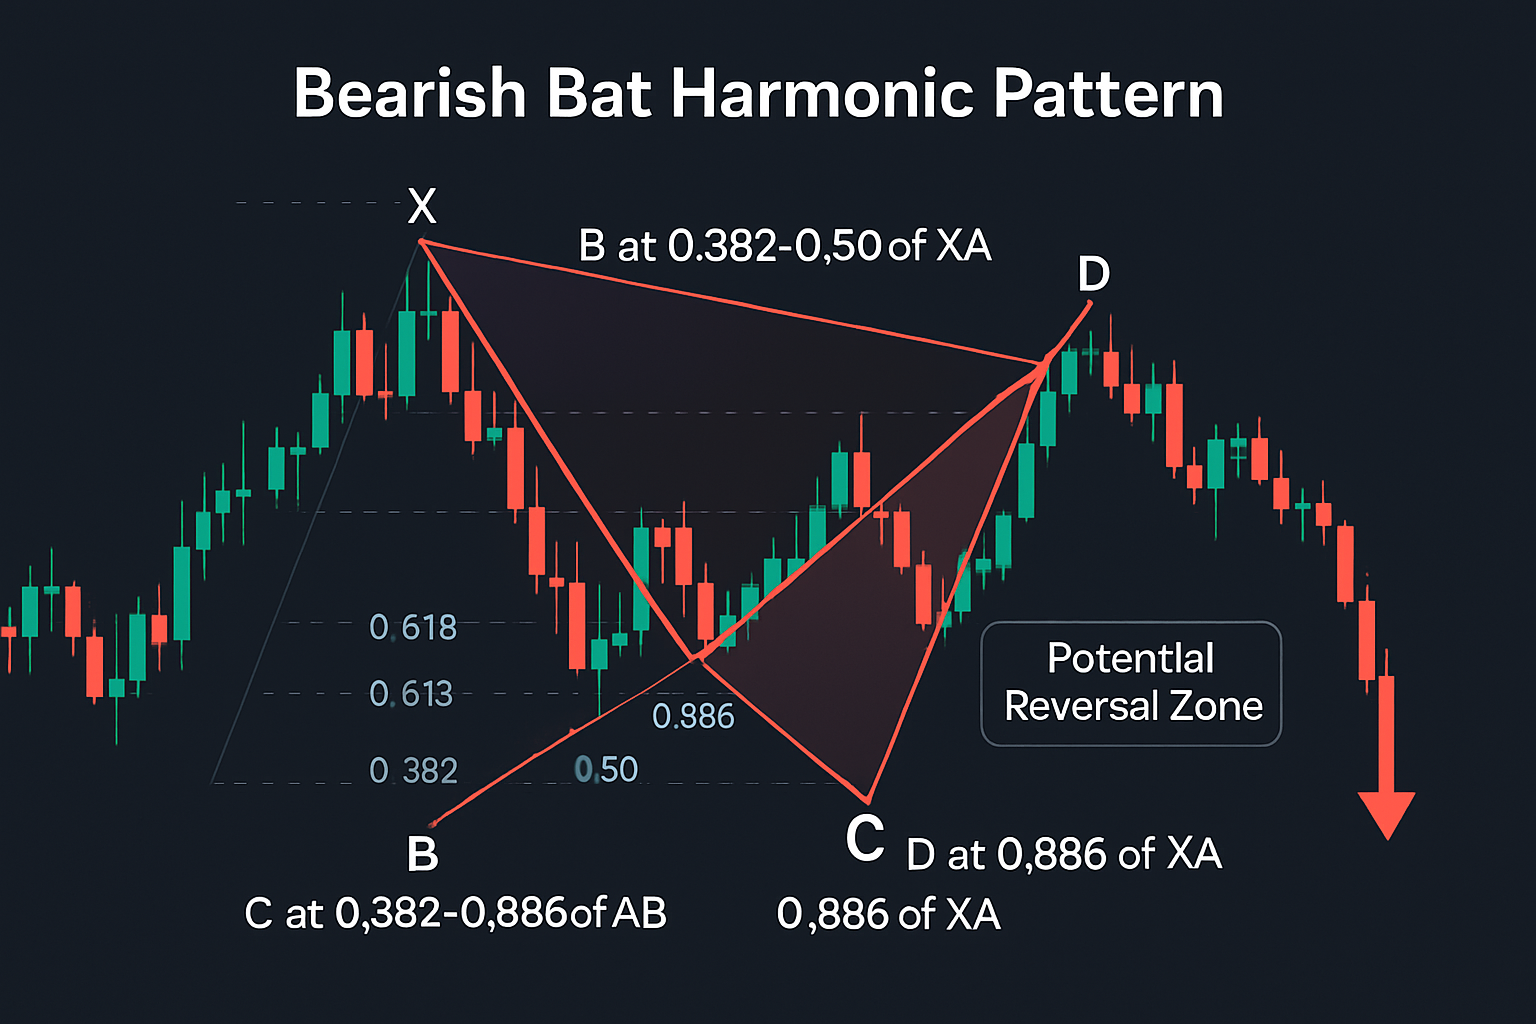
In a bearish Bat pattern:
- The pattern forms after an uptrend
- Point D forms at the 0.886 retracement of XA
- The PRZ at point D represents a selling opportunity
- Traders look for confirmation signals at point D before entering short positions
- Stop losses are typically placed just above the D point
The bearish Bat pattern can signal the end of an uptrend and the beginning of a new downtrend, providing traders with a precise entry point for short positions with clearly defined risk parameters.
How to Identify the Bat Harmonic Pattern
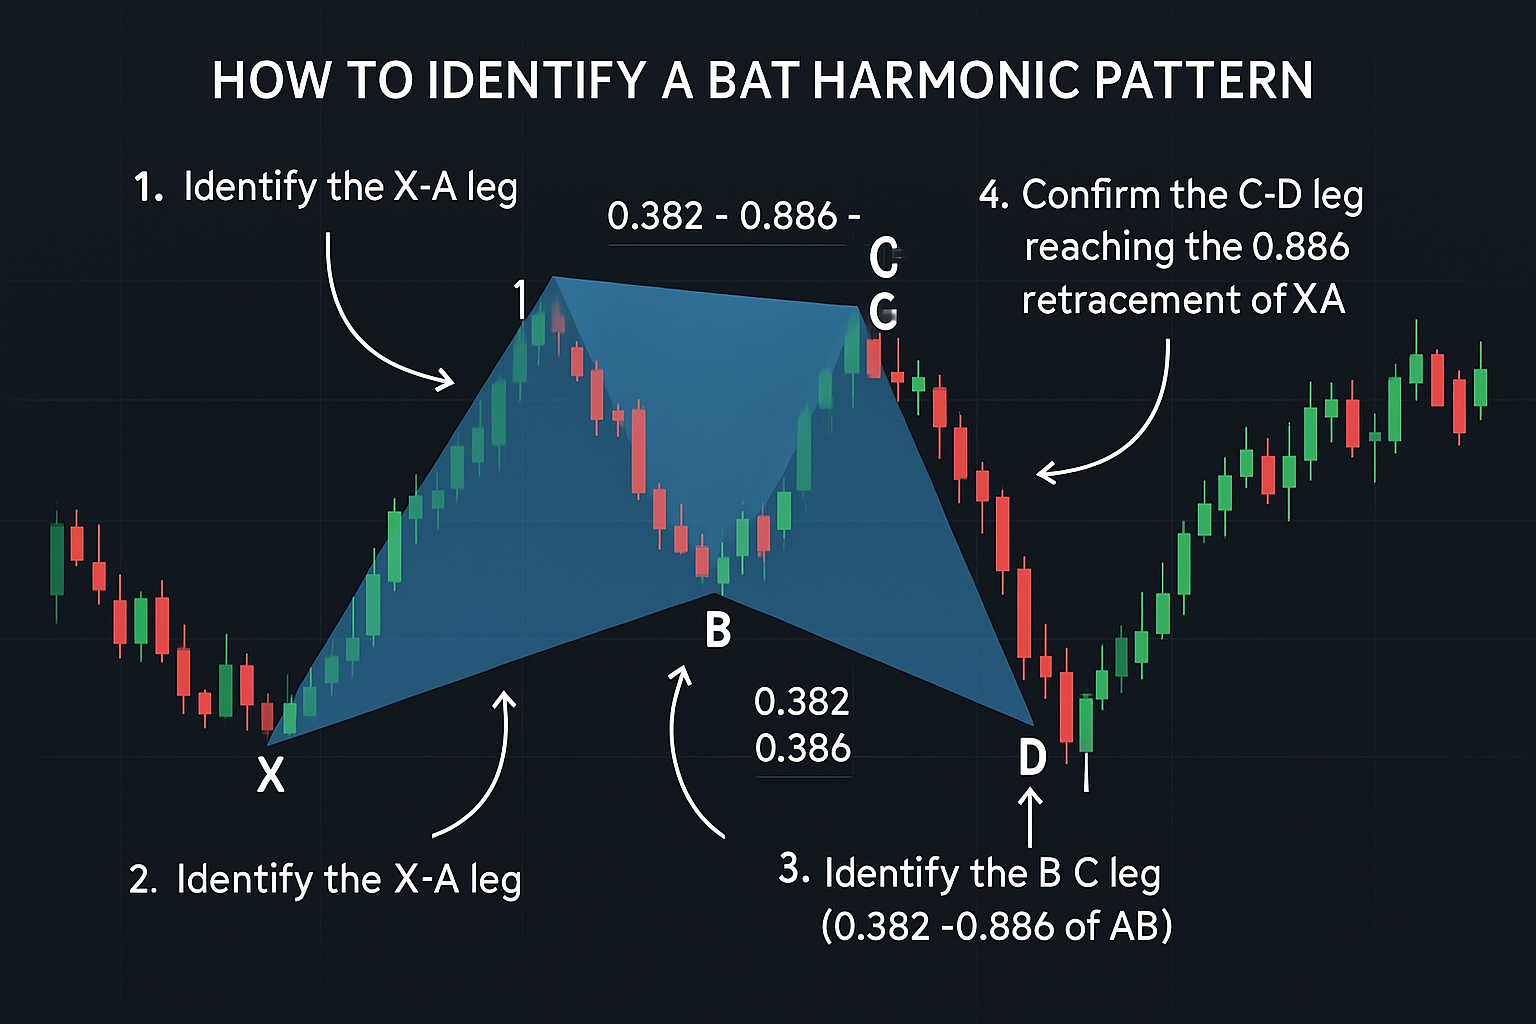
Identifying the Bat pattern requires careful analysis of price movements and precise measurement of Fibonacci ratios. Here's a step-by-step guide to spotting this pattern on your charts:
-
Identify the XA leg: Look for a significant price move that could form the first leg of the pattern.
-
Measure the AB retracement: The B point should retrace between 0.382 and 0.50 of the XA leg. This is a critical measurement that distinguishes the Bat from other harmonic patterns.
-
Identify the BC leg: Point C should form between 0.382 and 0.886 of the AB leg, with the most common retracement being around 0.618.
-
Confirm the D point: The most critical aspect of the Bat pattern is that point D must form at precisely the 0.886 retracement of the XA leg. This creates the Potential Reversal Zone (PRZ).
-
Validate the pattern structure: Ensure that the overall shape resembles a bat with wings and that all Fibonacci measurements align with the required ratios.
The precision of these measurements is what gives the Bat pattern its reliability. Traders should use proper charting tools with Fibonacci measurement capabilities to accurately identify these patterns.
How to Trade the Bat Harmonic Pattern
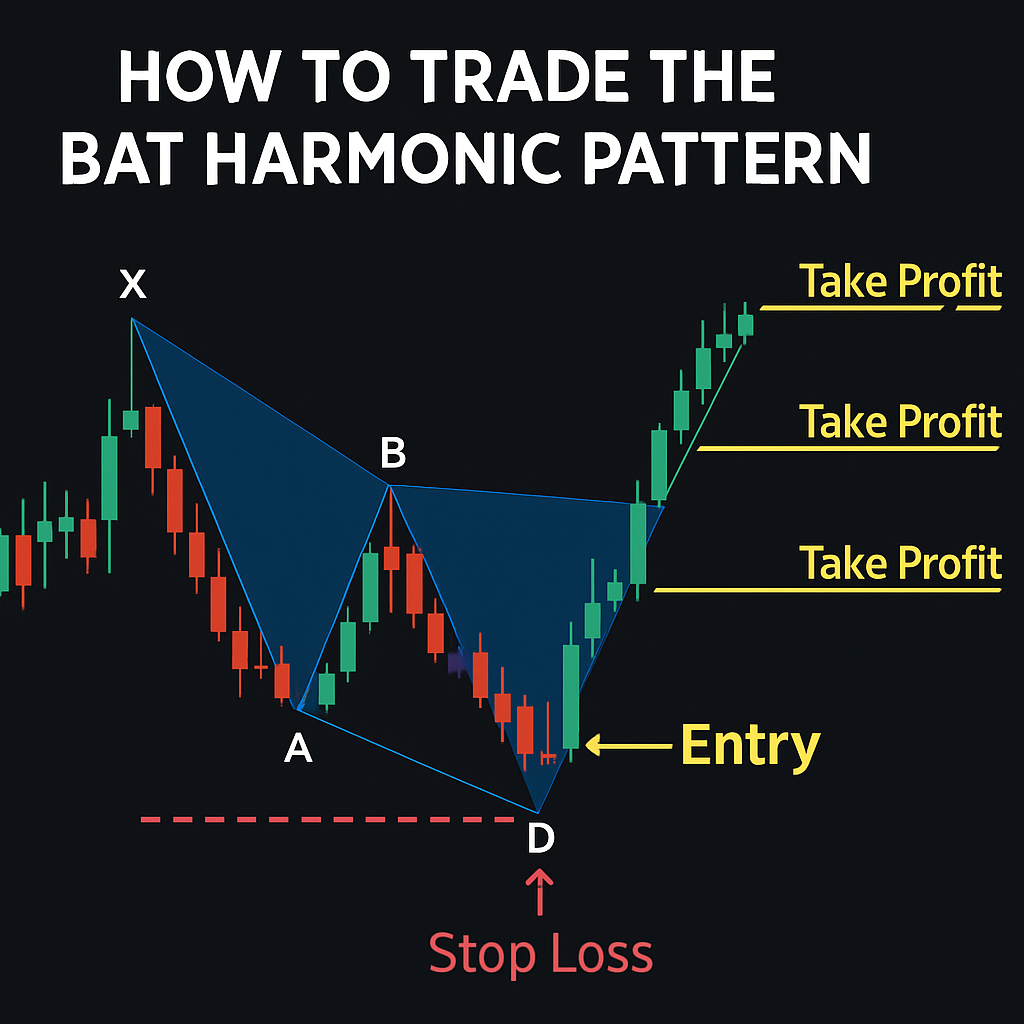
Trading the Bat pattern effectively requires a systematic approach to entry, stop loss placement, and profit targets. Here's a comprehensive strategy for trading this powerful pattern:
Entry Strategy
The optimal entry point for trading the Bat pattern is at or near point D (the PRZ), where price is expected to reverse:
- Wait for the pattern completion: Ensure all Fibonacci measurements meet the Bat pattern criteria.
- Look for confirmation signals: Don't enter immediately at point D; wait for confirmation signals such as candlestick patterns, indicator divergences, or support/resistance confluence.
- Enter with precision: Place limit orders at the PRZ rather than market orders to ensure optimal entry price.
Stop Loss Placement
Proper risk management is essential when trading the Bat pattern:
- For bullish patterns: Place stop loss slightly below point D (typically 5-10 pips or 1-2% below, depending on the market and timeframe).
- For bearish patterns: Place stop loss slightly above point D (typically 5-10 pips or 1-2% above, depending on the market and timeframe).
- Consider volatility: Adjust stop loss distance based on the volatility of the instrument being traded.
Take Profit Targets
The Bat pattern offers multiple profit targets based on Fibonacci extensions:
- First target: 38.2% to 61.8% retracement of the AD leg
- Second target: 100% of the AD leg (returning to point A)
- Third target: 1.618 extension of the AD leg
Many traders divide their position into three parts and close each part at different profit targets to maximize the trade's potential while securing partial profits along the way.
Confirmation Techniques for the Bat Pattern
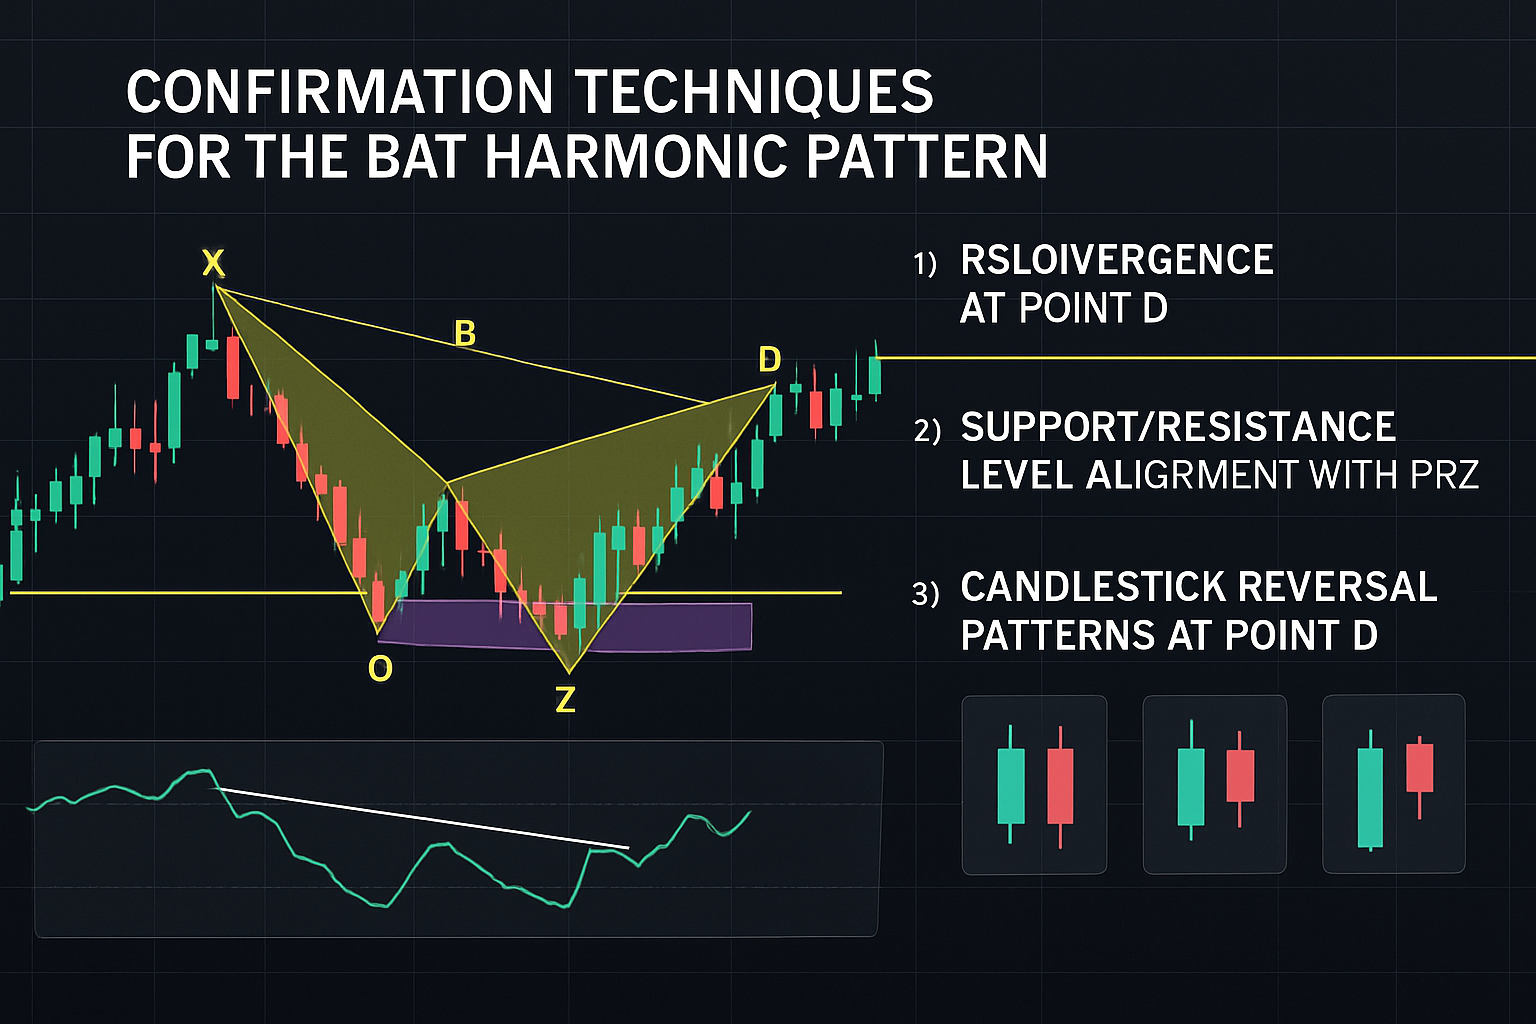
To increase the reliability of Bat pattern trades, use these confirmation techniques before entering a position:
1. RSI Divergence
Look for divergence between price and the Relative Strength Index (RSI) at point D:
- In a bullish Bat, price makes a lower low while RSI makes a higher low (bullish divergence)
- In a bearish Bat, price makes a higher high while RSI makes a lower high (bearish divergence)
2. Support and Resistance Confluence
The most powerful Bat patterns occur when point D aligns with existing support or resistance levels:
- For bullish patterns, point D should coincide with a strong support level
- For bearish patterns, point D should coincide with a strong resistance level
3. Candlestick Reversal Patterns
Look for reversal candlestick patterns at point D to confirm the reversal:
- For bullish Bats: hammer, bullish engulfing, morning star
- For bearish Bats: shooting star, bearish engulfing, evening star
4. Volume Analysis
Increased trading volume at point D can confirm the strength of the reversal:
- For bullish patterns, look for higher volume on the reversal candle
- For bearish patterns, look for higher volume on the breakdown candle
Common Mistakes When Trading the Bat Pattern
Even experienced traders can make mistakes when trading the Bat pattern. Here are some common pitfalls to avoid:
-
Incorrect measurement: Using imprecise Fibonacci measurements can lead to false pattern identification. Always double-check your measurements.
-
Ignoring market context: Trading the Bat pattern without considering the broader market trend, support/resistance levels, and other technical factors.
-
Premature entry: Entering trades as soon as price reaches the PRZ without waiting for confirmation signals.
-
Poor risk management: Setting stop losses too tight or too wide, or not having a clear profit target strategy.
-
Overtrading: Looking for Bat patterns in all timeframes and all markets simultaneously, leading to low-quality trade setups.
Best Timeframes and Markets for Bat Pattern Trading
The Bat pattern can be found across various timeframes and markets, but certain conditions yield better results:
Timeframes
The Bat pattern works on all timeframes, but higher timeframes generally produce more reliable signals:
- Daily and 4-hour charts: Best for swing trading with higher reliability
- 1-hour charts: Good for day trading with moderate reliability
- 15-minute and below: Can be used for scalping but with reduced reliability
Markets
The Bat pattern can be traded in any financial market with sufficient liquidity:
- Forex: Particularly effective in major currency pairs
- Stock indices: Works well on major indices like S&P 500, NASDAQ, and Dow Jones
- Commodities: Can be applied to gold, oil, and other major commodities
- Cryptocurrencies: Effective in major cryptocurrencies like Bitcoin and Ethereum
Combining the Bat Pattern with Other Trading Concepts
The Bat pattern becomes even more powerful when combined with other technical analysis tools:
- Trend analysis: Trade Bat patterns that align with the overall trend for higher probability setups
- Moving averages: Use moving averages to confirm the direction after a Bat pattern reversal
- Elliott Wave Theory: Bat patterns often form at the end of wave 5 or C, providing additional confirmation
- Market structure: Look for Bat patterns that form at key market structure levels
FAQ
Can you trade the Bat Harmonic Pattern by itself?
No, the Bat Harmonic Pattern should not be traded in isolation. It should be used in confluence with other technical analysis tools such as support/resistance levels, trend analysis, and confirmation indicators to increase the probability of successful trades.
Can you trade the Bat Harmonic Pattern in any market?��
Yes, the Bat Harmonic Pattern can be traded in any financial market with sufficient liquidity, including forex, stocks, indices, commodities, and cryptocurrencies. The pattern is based on universal market psychology and Fibonacci relationships that apply across all markets.
Can you trade the Bat Harmonic Pattern in any timeframe?
Yes, the Bat Harmonic Pattern can be identified and traded on any timeframe, from 1-minute charts to monthly charts. However, higher timeframes (4H, daily, weekly) typically produce more reliable signals with fewer false patterns and better risk-reward ratios.