Butterfly Harmonic Pattern Trading Guide
The Butterfly Harmonic Pattern is one of the most powerful reversal formations in technical analysis, providing traders with precise entry and exit points based on Fibonacci measurements. Our advanced detection tools help identify these patterns with exceptional accuracy.
What is the Butterfly Harmonic Pattern?
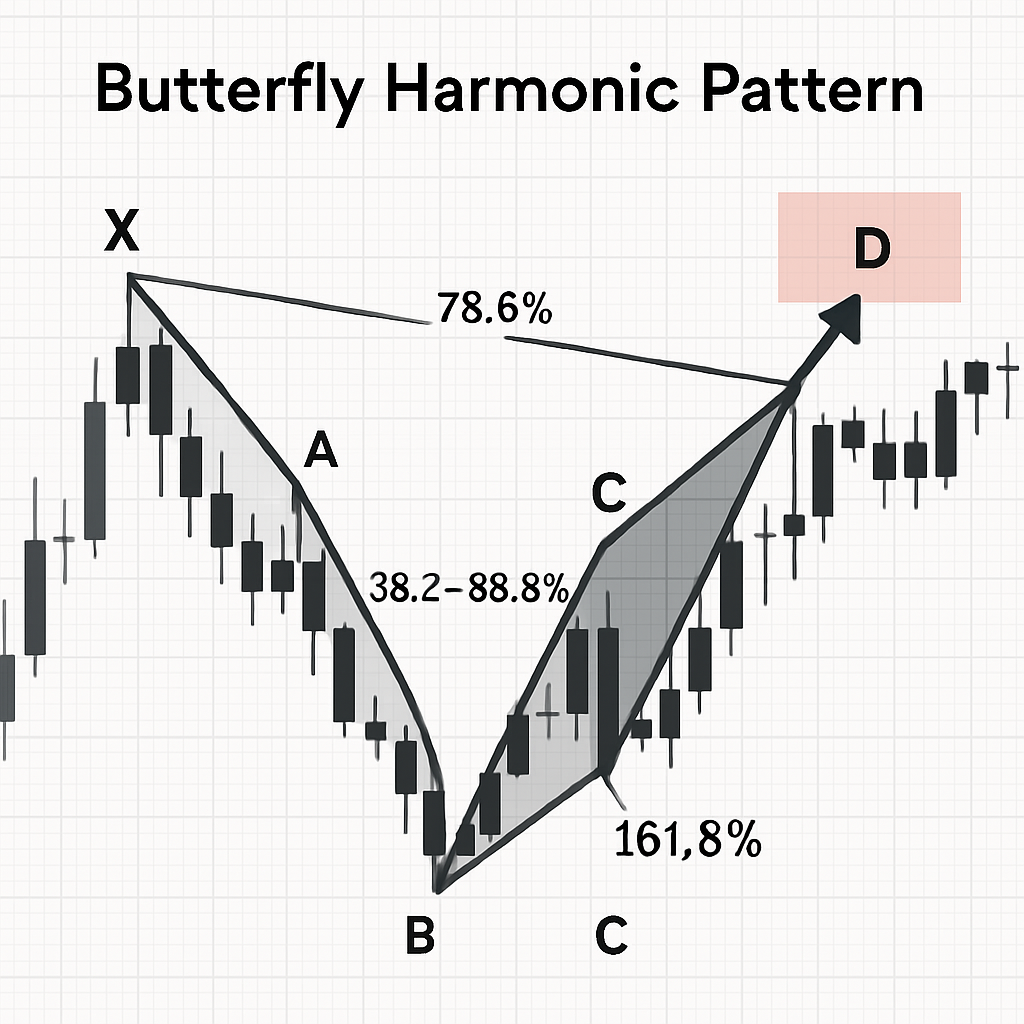
The Butterfly Harmonic Pattern is a five-point reversal chart pattern that predicts potential market turning points with remarkable accuracy. Discovered by Bryce Gilmore and later refined by Scott Carney, this pattern relies on specific Fibonacci ratios to identify high-probability reversal zones.
Unlike conventional chart patterns, the Butterfly formation follows strict mathematical relationships between its components, making it a precise tool for identifying market reversals. The pattern consists of four price legs (XA, AB, BC, and CD) that form a distinctive butterfly-like structure when complete.
Bullish Butterfly Pattern
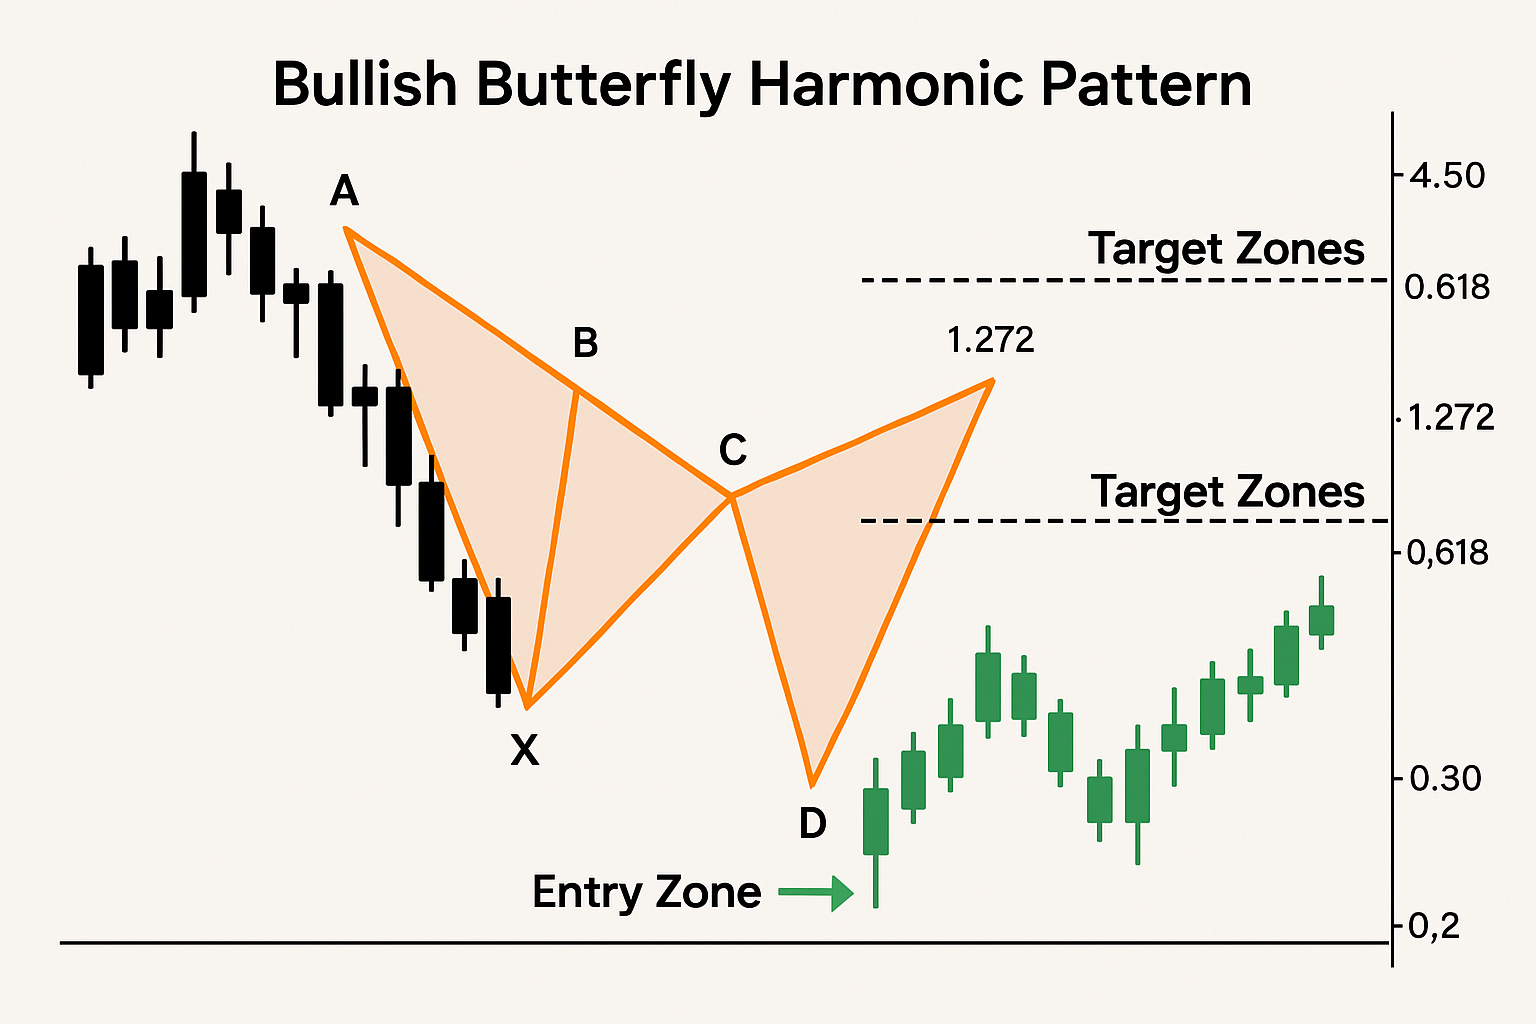
A bullish Butterfly pattern forms at the end of a downtrend and signals a potential reversal to the upside. It begins with a downward XA leg, followed by an AB retracement, a BC leg, and finally a CD extension that reaches the Potential Reversal Zone (PRZ).
Bearish Butterfly Pattern
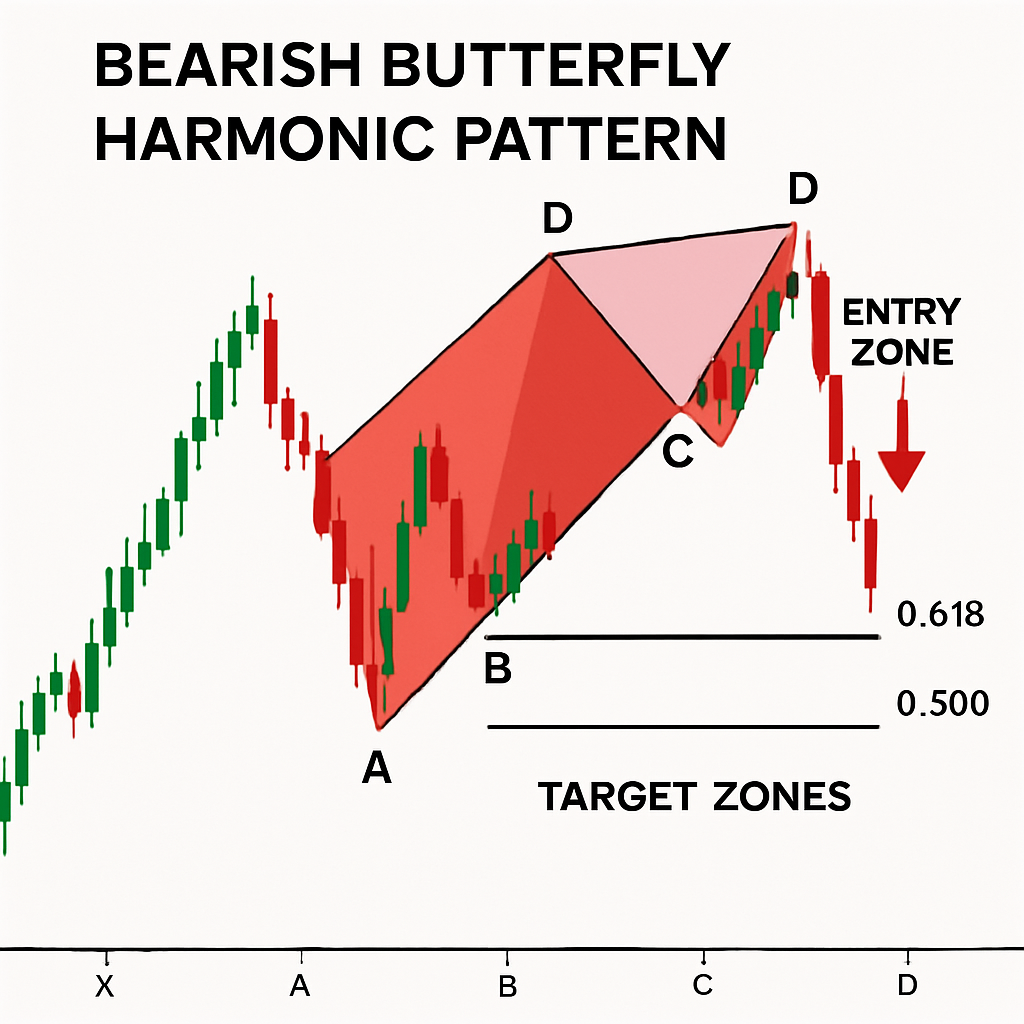
A bearish Butterfly pattern appears at the end of an uptrend and indicates a possible reversal to the downside. The pattern starts with an upward XA leg, followed by the AB, BC, and CD legs that complete the formation at the PRZ.
How to Identify the Butterfly Harmonic Pattern
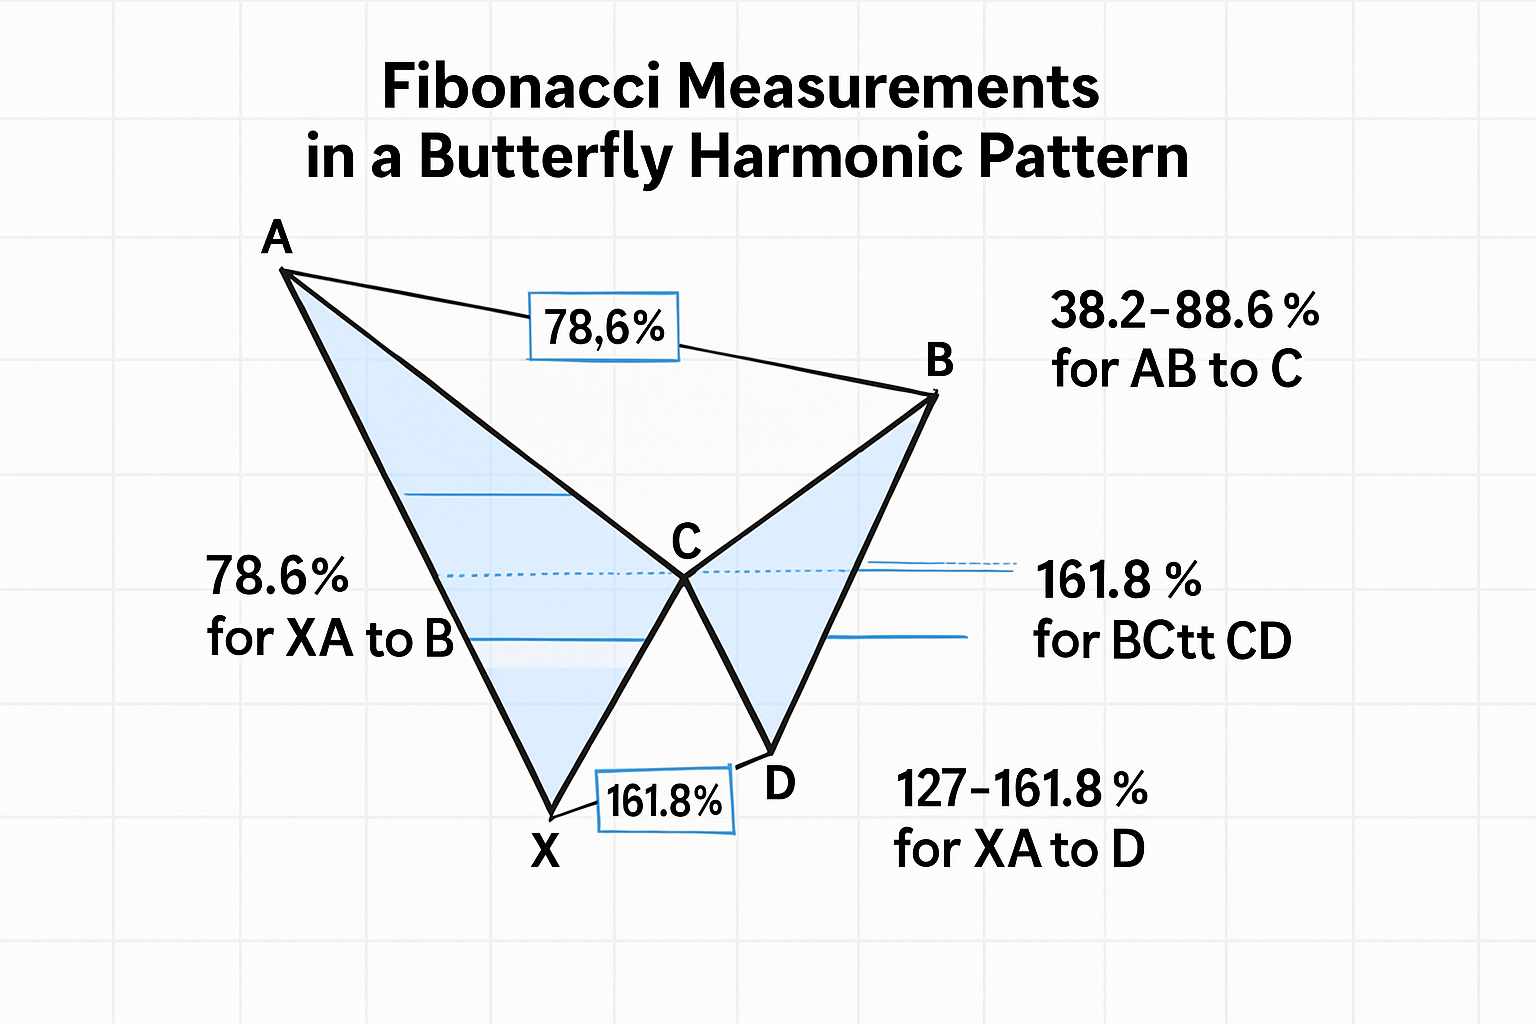
The Butterfly pattern is distinguished by its specific Fibonacci relationships. To identify a valid Butterfly pattern, you must verify that each leg meets the following precise measurements:
Essential Fibonacci Ratios
The Butterfly pattern requires specific Fibonacci ratios to be valid:
- XA Leg: The initial price movement that establishes the pattern direction
- AB Leg: Must retrace exactly 78.6% of the XA leg (this is the defining characteristic)
- BC Leg: Should retrace between 38.2% and 88.6% of the AB leg
- CD Leg: Must extend to 161.8% or 224% of the BC leg
- XD Projection: The D point should be at the 127% or 161.8% extension of the XA leg
Pattern Validation Checklist
To confirm a valid Butterfly pattern, ensure all these conditions are met:
- The B point must be a precise 78.6% retracement of XA (mandatory)
- The pattern must include an AB=CD formation or a 1.27 AB=CD pattern
- The D point must align with the 127% or 161.8% extension of XA
- The pattern should form after a significant trend movement
When all these elements align, a high-probability reversal zone (PRZ) is established at point D, offering traders an optimal entry opportunity.
How to Trade the Butterfly Harmonic Pattern
Trading the Butterfly pattern effectively requires a systematic approach to entry, stop-loss placement, and profit targets.
Entry Strategy
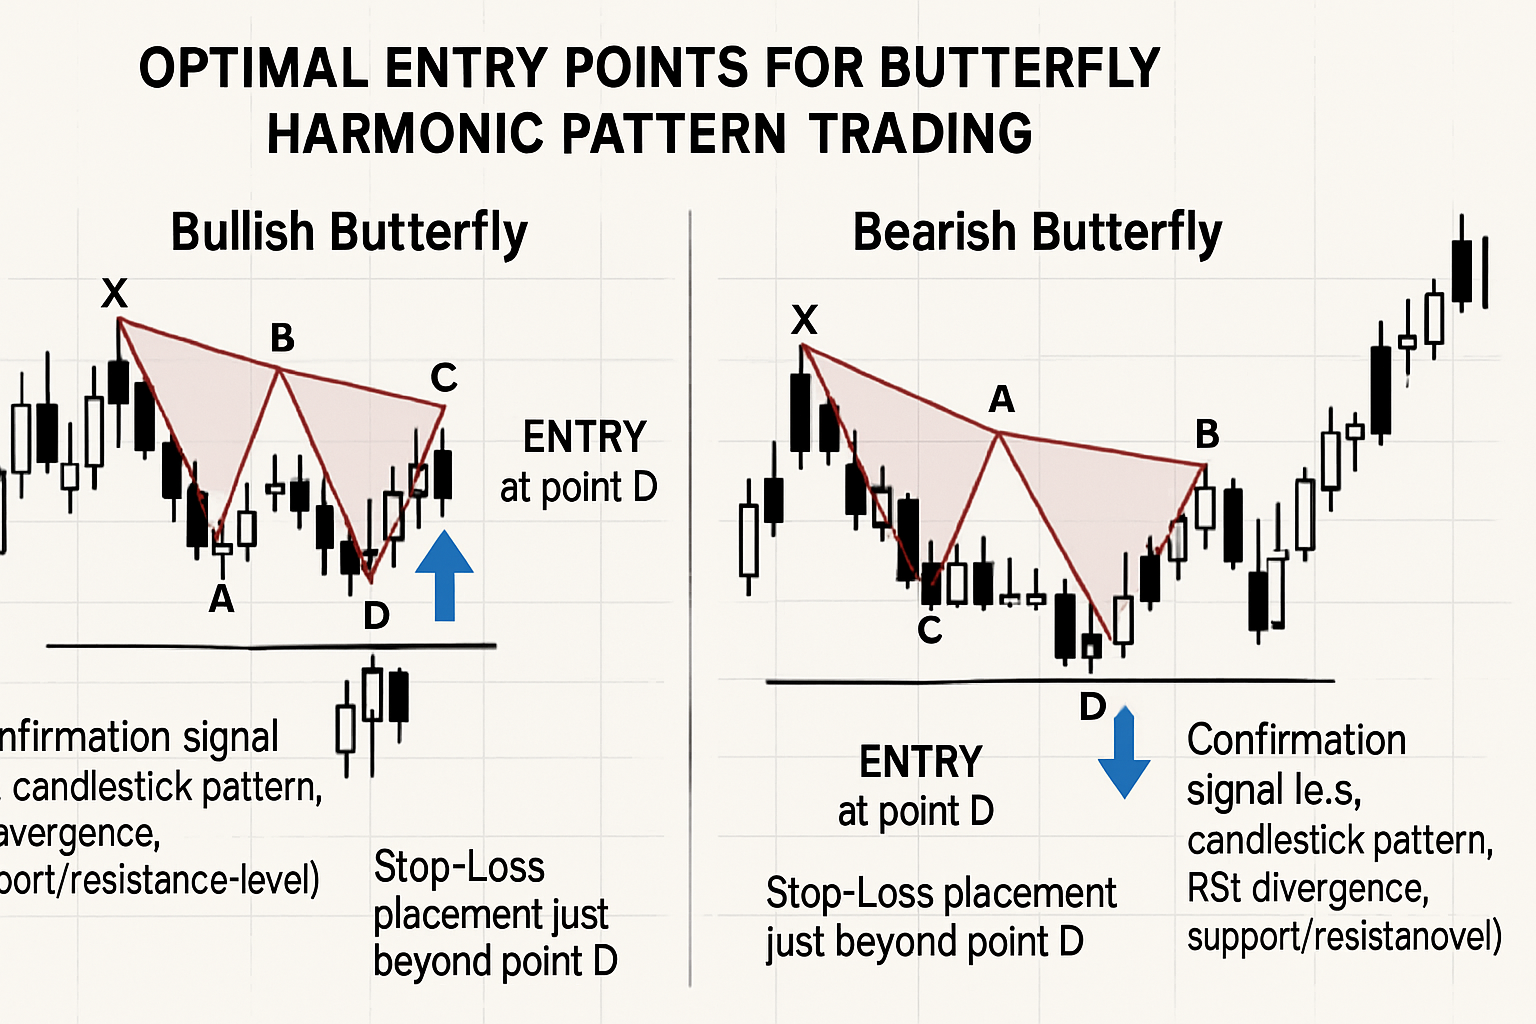
The ideal entry point occurs when price reaches the Potential Reversal Zone (PRZ) at point D. This zone is where multiple Fibonacci projections converge, creating a high-probability reversal area.
For bullish patterns:
- Enter a long position when price reaches the PRZ and shows reversal confirmation
- Look for supporting evidence like candlestick reversal patterns, divergence, or support from other technical indicators
For bearish patterns:
- Enter a short position when price reaches the PRZ and shows reversal confirmation
- Confirm with bearish candlestick patterns, divergence, or resistance from other technical indicators
Stop-Loss Placement
Proper risk management is crucial when trading the Butterfly pattern:
- For bullish patterns: Place stop-loss slightly below the D point (PRZ)
- For bearish patterns: Place stop-loss slightly above the D point (PRZ)
- Typical stop-loss range: 1-3% beyond the PRZ, depending on market volatility
Profit Targets
The Butterfly pattern offers multiple profit-taking opportunities:
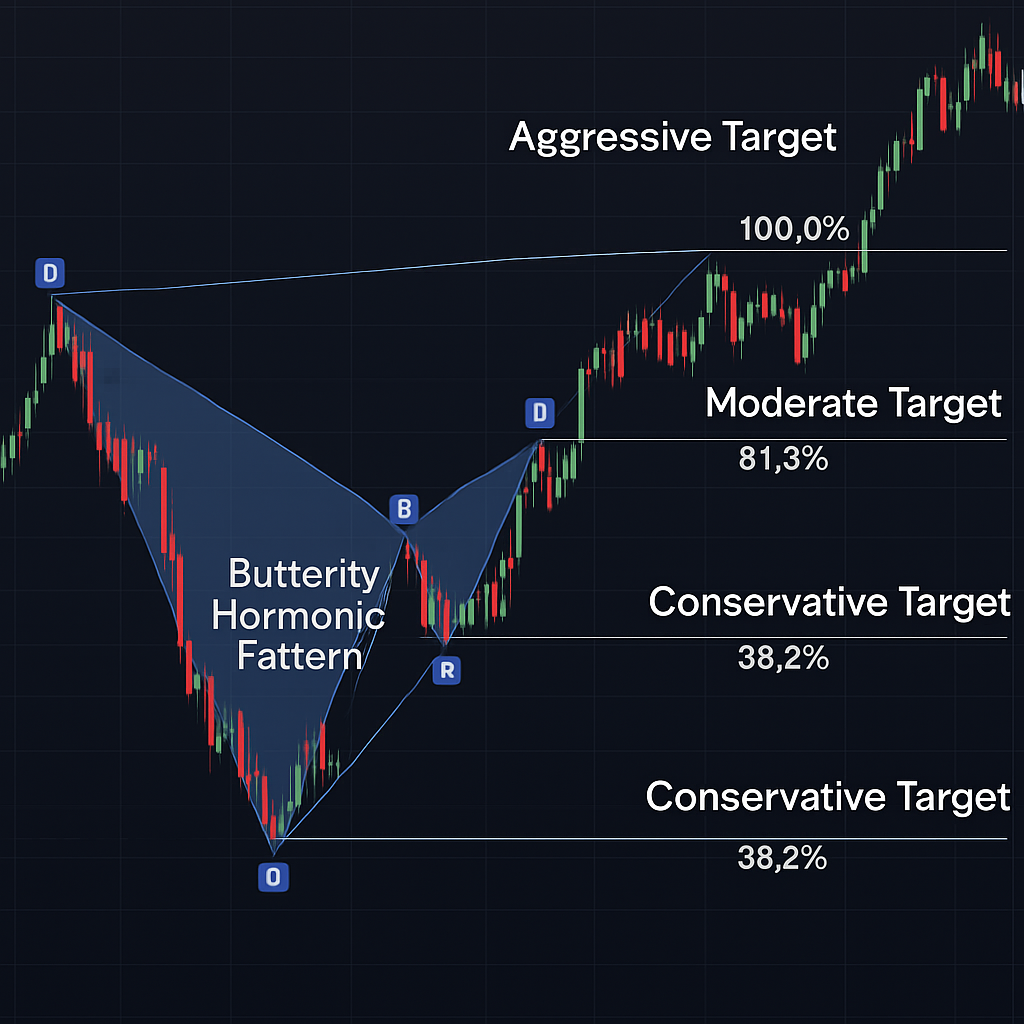
- Conservative target: 38.2% retracement of the CD leg
- Moderate target: 61.8% retracement of the CD leg
- Aggressive target: 100% retracement of the CD leg (back to point C)
- Extended target: Beyond point C toward point B (for strong reversals)
Advanced Butterfly Pattern Trading Strategies
Experienced traders can enhance their Butterfly pattern trading with these advanced techniques:
Confluence with Support and Resistance
The most powerful Butterfly patterns form when the PRZ aligns with established support or resistance levels. This confluence increases the probability of a successful reversal.
Volume Confirmation
Volume should decrease during pattern formation and increase significantly at the reversal point. A surge in volume at point D confirms strong participation in the reversal.
Harmonic Pattern Combinations
Butterfly patterns often appear alongside other harmonic patterns or technical formations. Look for:
- Multiple harmonic patterns with overlapping PRZs
- Trendline breaks coinciding with the PRZ
- Key moving average levels aligning with the PRZ
Time-Based Filters
Apply time-based analysis to filter higher-probability setups:
- Higher timeframe patterns (daily, weekly) tend to be more reliable
- Patterns that form during high-liquidity market hours often perform better
- Seasonal tendencies can affect pattern performance
Common Mistakes to Avoid
Even experienced traders can make these common errors when trading the Butterfly pattern:
- Ignoring exact Fibonacci ratios: The 78.6% retracement at point B is mandatory
- Premature entry: Entering before price reaches the PRZ can lead to larger drawdowns
- Missing confirmation signals: Relying solely on the pattern without confirmation
- Improper stop-loss placement: Setting stops too tight or too loose
- Overlooking market context: Ignoring the broader market environment and trend
Butterfly Pattern Trading Examples
Let's examine real-world examples of successful Butterfly pattern trades:
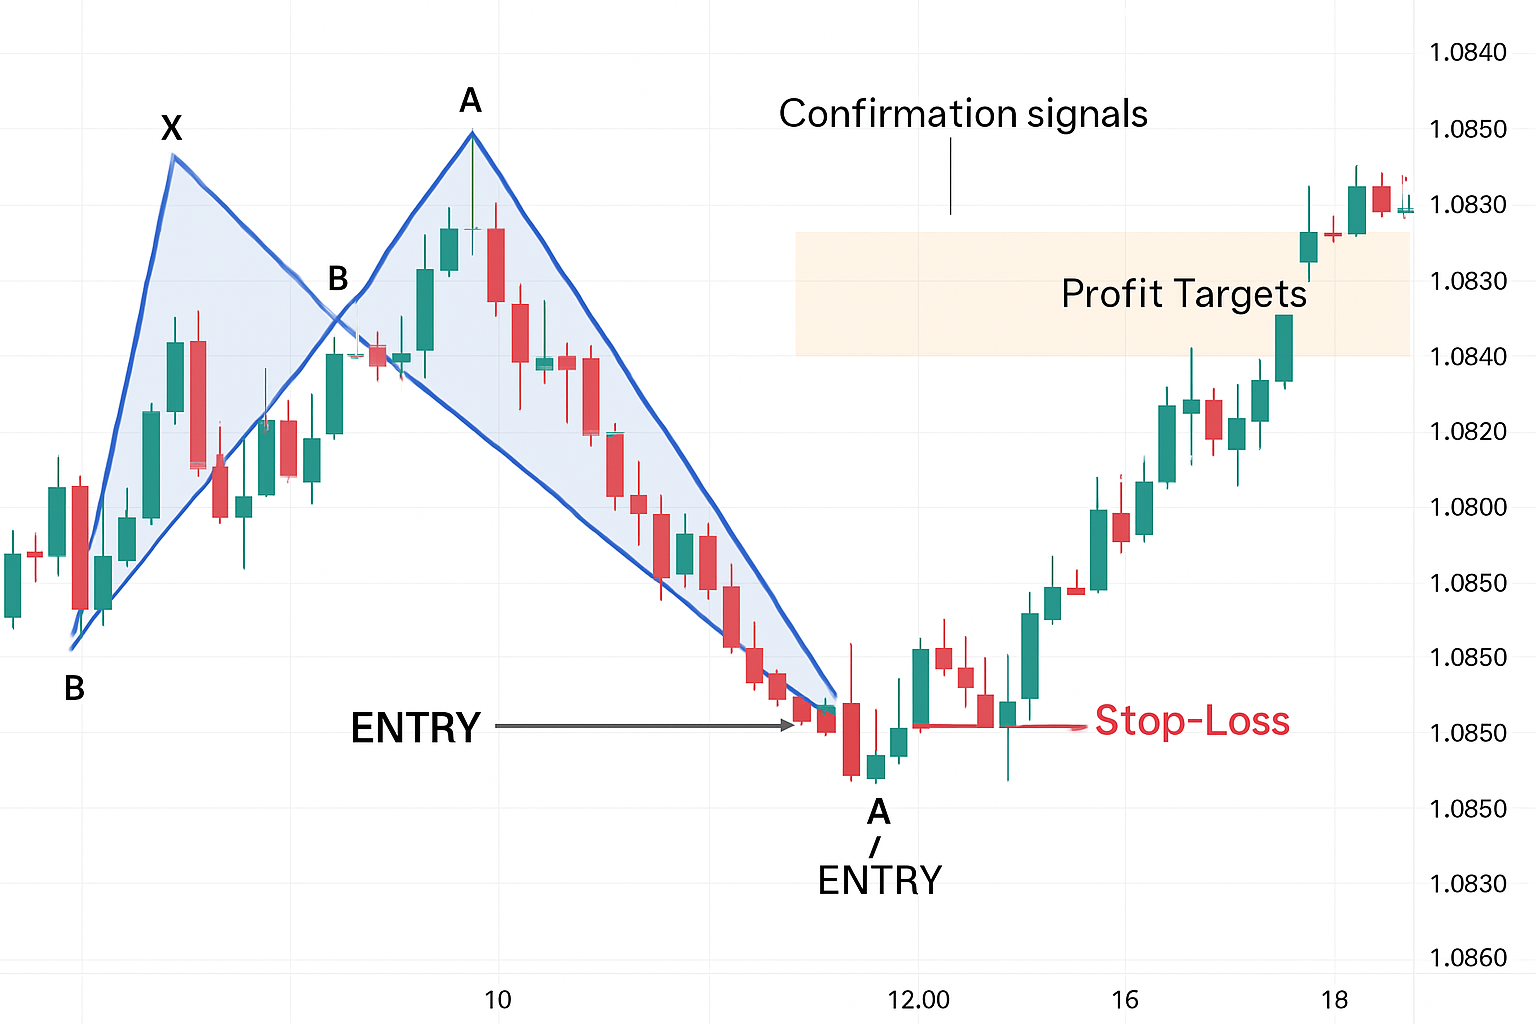
Example 1: Bullish Butterfly in Forex Market
This EUR/USD daily chart shows a perfect bullish Butterfly pattern that formed after a prolonged downtrend. Note how price respected the PRZ exactly before reversing sharply upward.
Example 2: Bearish Butterfly in Stock Market
This example from the S&P 500 demonstrates a bearish Butterfly pattern that formed at a major resistance level. The pattern provided an excellent short opportunity with minimal risk.
FAQ
Can you trade the Butterfly Harmonic Pattern by itself?
No, the Butterfly pattern should not be traded in isolation. It works best when used in confluence with other technical analysis tools, support/resistance levels, and overall market context as part of a comprehensive trading strategy.
Can you trade the Butterfly Harmonic Pattern in any market?
Yes, the Butterfly pattern works effectively across all financial markets including forex, stocks, commodities, and cryptocurrencies. The pattern is based on universal market psychology and Fibonacci relationships that apply to all traded instruments.
Can you trade the Butterfly Harmonic Pattern in any timeframe?
Yes, the Butterfly pattern can be identified and traded on any timeframe from 1-minute charts to monthly charts. However, higher timeframes (4H, daily, weekly) typically produce more reliable signals with better risk-reward ratios.