Crab Harmonic Pattern Explained
The Crab Harmonic Pattern is an advanced reversal pattern in technical analysis, known for its high accuracy in identifying potential turning points in the market. Developed by Scott Carney, this pattern is characterized by specific Fibonacci ratios that define its structure, making it a powerful tool for traders seeking precise entry and exit points.
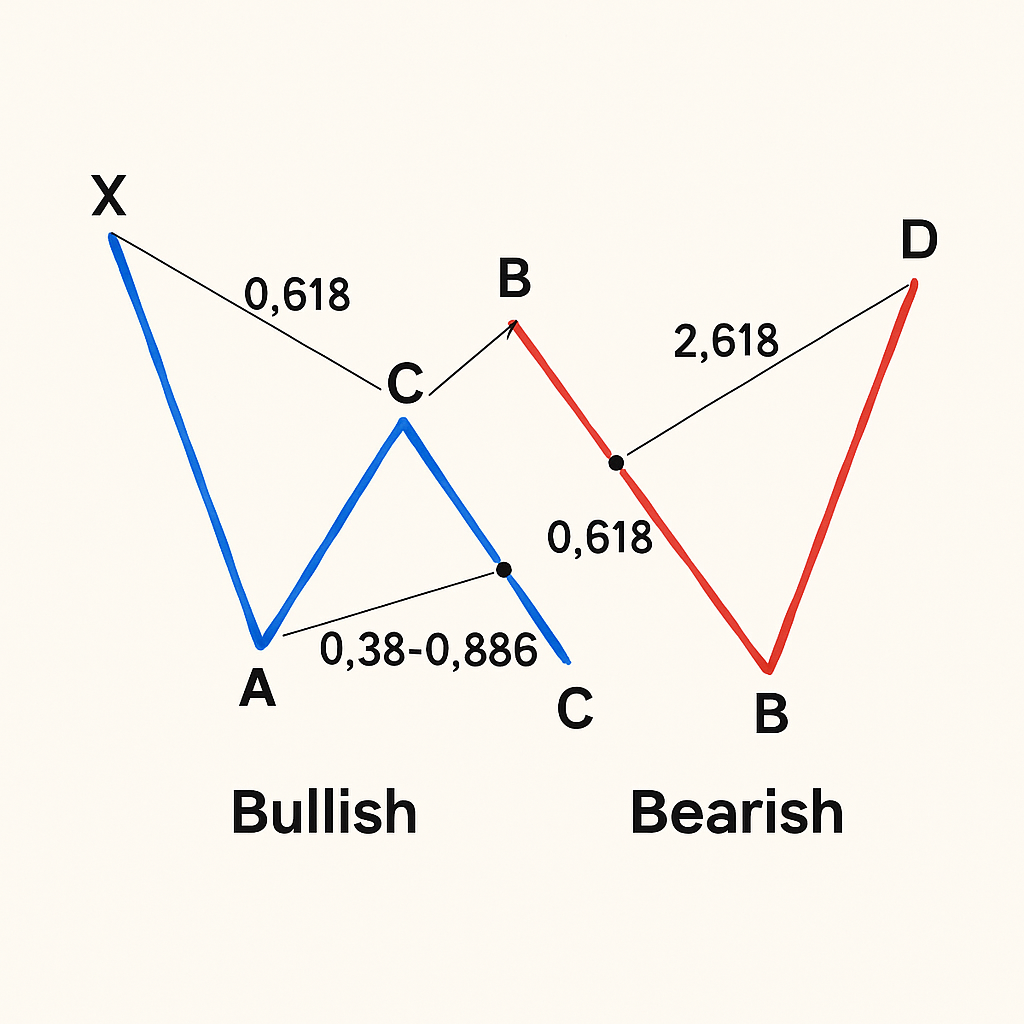
What is the Crab Harmonic Pattern?
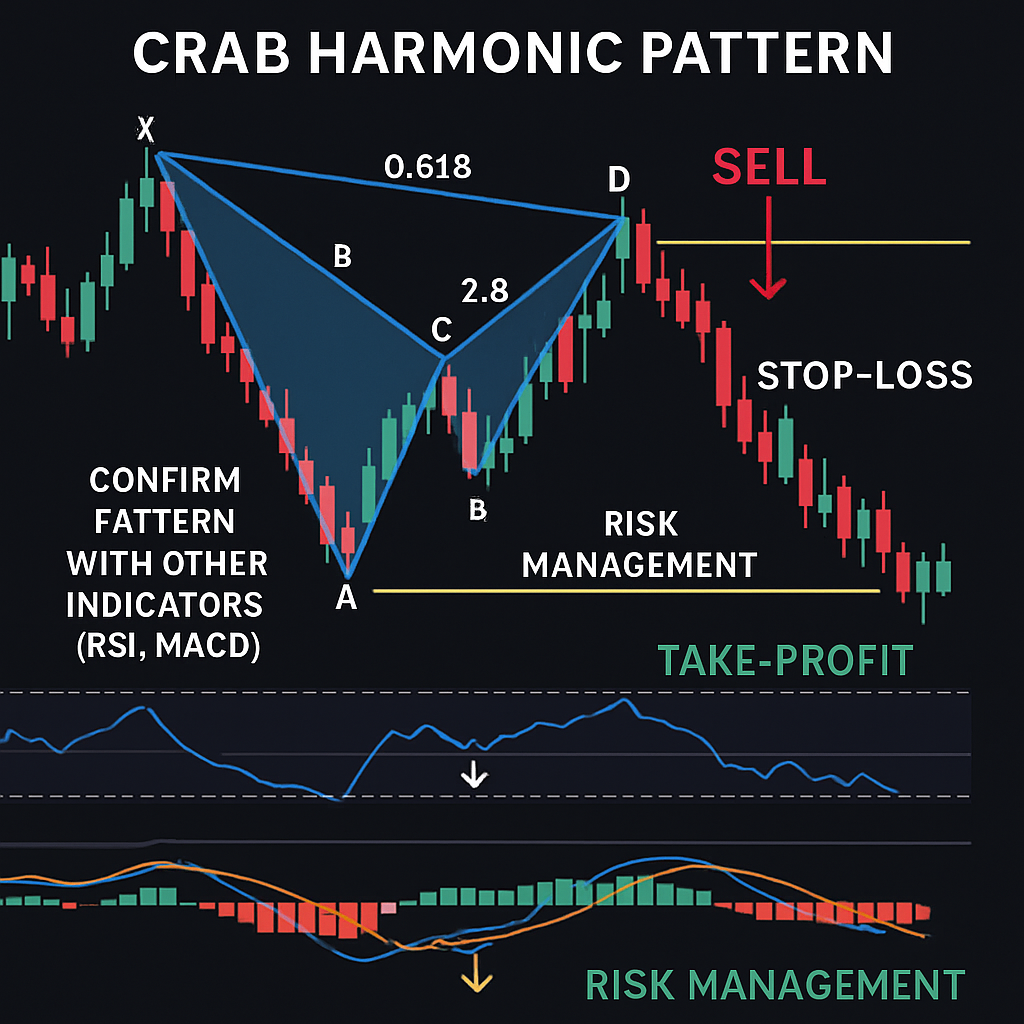
The Crab pattern is a five-point reversal structure (X, A, B, C, D) that extends beyond the initial price swing (XA leg). Its defining characteristic is the extreme 1.618 Fibonacci extension of the XA leg to form the D point, which is crucial for its high accuracy. This pattern suggests an imminent reversal of the current trend, offering significant risk-reward opportunities.
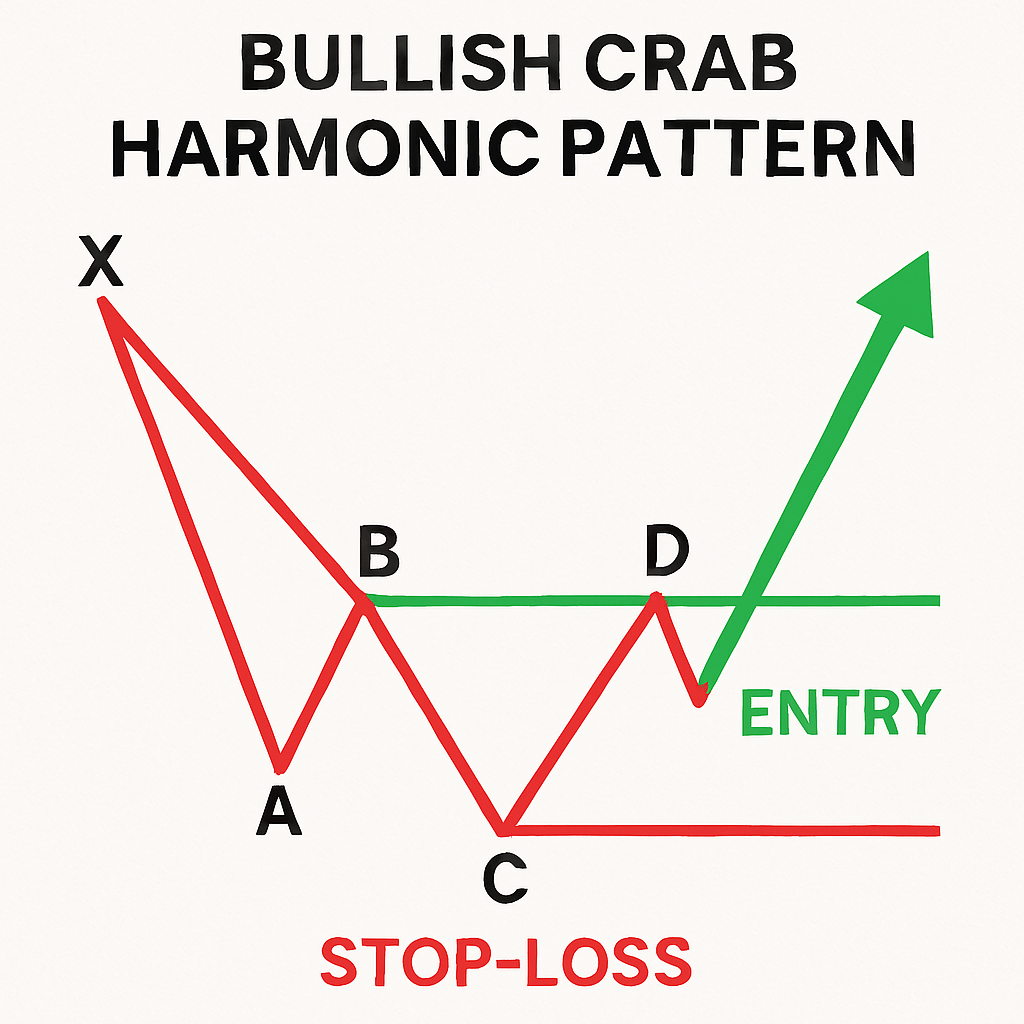
Bullish Crab Pattern
A bullish Crab pattern forms after a downtrend and signals a potential bullish reversal. The D point, located at the 1.618 extension of XA, represents a strong potential reversal zone (PRZ) where buying pressure is expected to emerge.
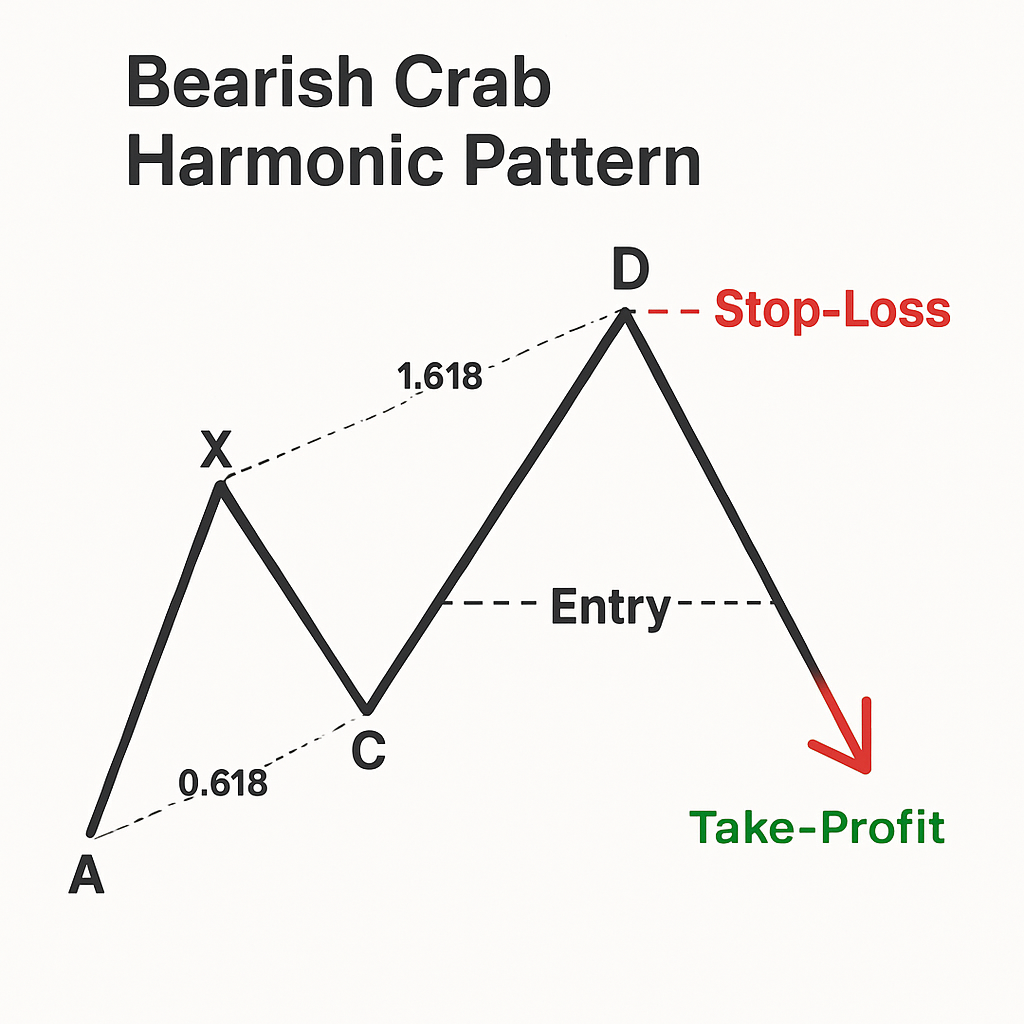
Bearish Crab Pattern
A bearish Crab pattern forms after an uptrend and indicates a potential bearish reversal. Similar to its bullish counterpart, the D point at the 1.618 extension of XA acts as a critical PRZ where selling pressure is anticipated.
How to Identify the Crab Harmonic Pattern
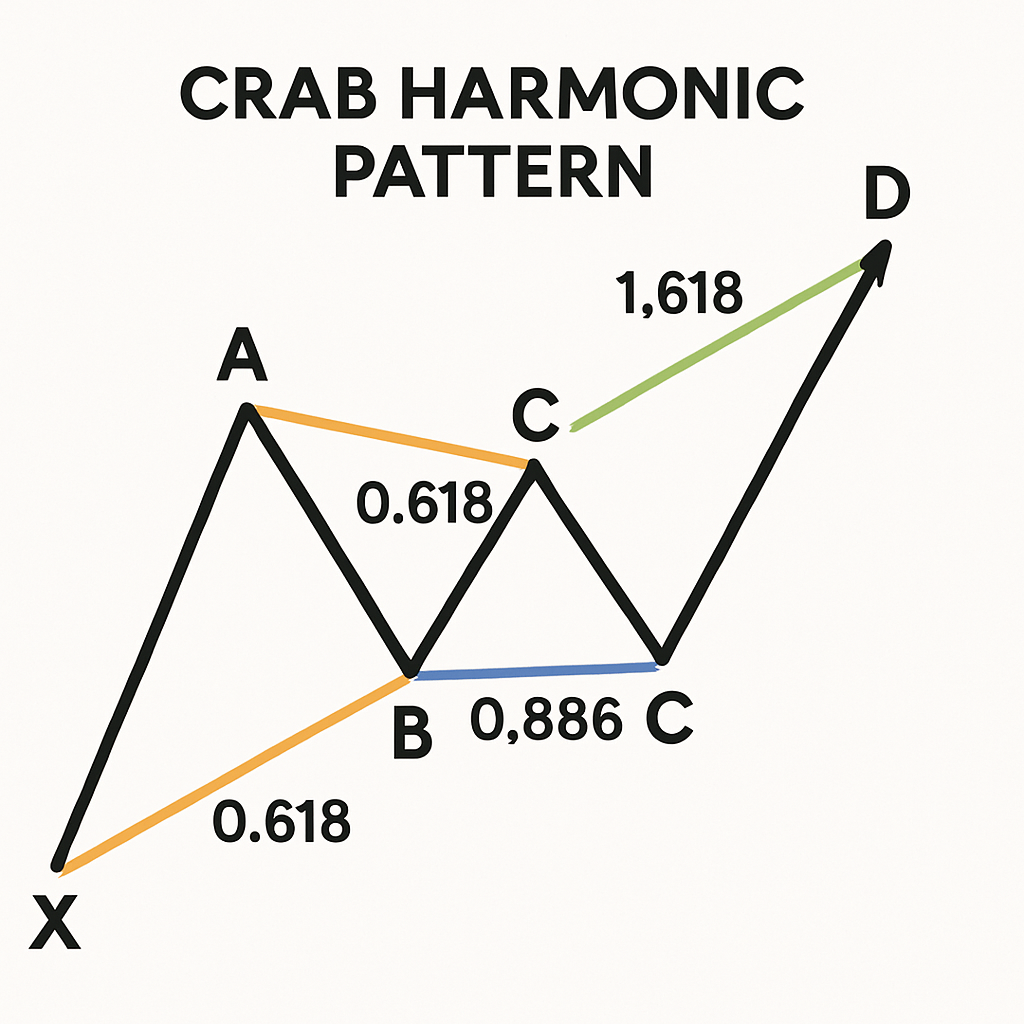
Identifying the Crab Harmonic Pattern requires precise measurement of Fibonacci ratios:
- XA Leg: The initial price swing.
- AB Retracement: The B point should retrace 0.382 to 0.618 of the XA leg.
- BC Retracement: The C point can retrace 0.382 to 0.886 of the AB leg.
- CD Extension: The D point is the most critical, extending to the 1.618 Fibonacci extension of the XA leg. It can also be a 2.24 to 3.618 extension of the BC leg, or a 1.27 to 1.618 extension of the AB leg.
How to Trade the Crab Harmonic Pattern
Trading the Crab Harmonic Pattern involves several steps to maximize potential profits and manage risk:
- Confirmation: Wait for price action confirmation at the D point. This could be a reversal candlestick pattern, divergence with an oscillator (like RSI or MACD), or a break of a short-term trendline.
- Entry: Enter a trade near the D point, once confirmation is observed.
- Stop-Loss: Place a stop-loss order just beyond the D point or a significant support/resistance level to protect against invalidation of the pattern.
- Take-Profit: Target previous swing highs/lows or other Fibonacci levels (e.g., 0.382 or 0.618 retracement of the CD leg) for profit-taking.
FAQ
Can you trade the Crab Harmonic Pattern by itself? No, the Crab Harmonic Pattern should be used in confluence with other trading concepts and indicators in your trading strategy to increase its effectiveness and reliability.
Can you trade the Crab Harmonic Pattern in any market? Yes, the Crab Harmonic Pattern can be traded in various financial markets, including forex, stocks, commodities, and cryptocurrencies, as it is based on universal price action principles.
Can you trade the Crab Harmonic Pattern in any timeframe? Yes, the Crab Harmonic Pattern is applicable across different timeframes, from intraday charts to daily and weekly charts, making it versatile for various trading styles.