Gartley Harmonic Pattern Explained
The Gartley Harmonic Pattern is a renowned formation in technical analysis, offering traders insights into potential market reversals. Understanding its structure and Fibonacci ratios is key to leveraging its predictive power.
What is the Gartley Harmonic Pattern?
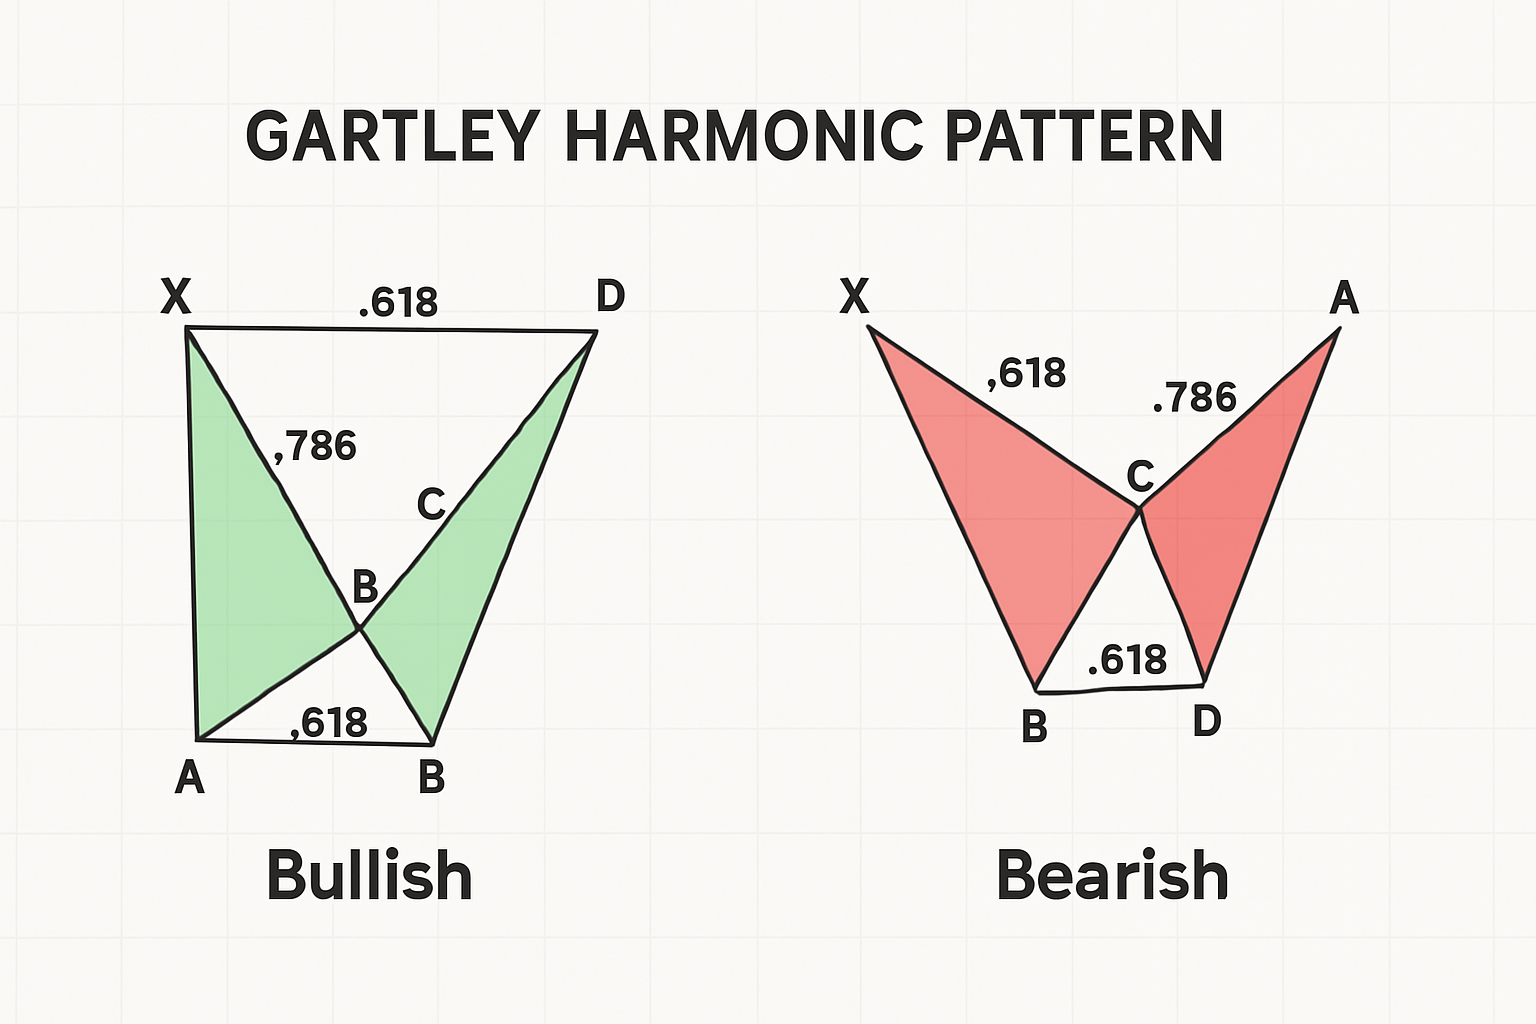
The Gartley pattern, a well-regarded formation in the realm of technical analysis, stands as one of the most established harmonic patterns. Originally introduced by H.M. Gartley in his 1935 book "Profits in the Stock Market," this pattern provides traders with a structured approach to identifying potential price reversals and continuation opportunities. It is often referred to as the "Gartley 222" pattern, a nod to the page number where it was detailed in Gartley's seminal work. The core concept behind the Gartley, and indeed all harmonic patterns, is the idea that financial markets exhibit geometric price patterns and that price movements often adhere to specific Fibonacci ratio relationships. These patterns aim to pinpoint reaction highs and lows, offering traders a more precise understanding of market dynamics.
Harmonic patterns, including the Gartley, are built upon the foundation of Fibonacci sequences and ratios. These mathematical relationships, found pervasively in nature, are applied by technical analysts to forecast potential support and resistance levels, as well as turning points in price action. The Gartley pattern itself is a 5-point structure, typically resembling an 'M' shape in bullish scenarios or a 'W' shape in bearish scenarios. These five points are labeled X, A, B, C, and D, and the segments connecting them (XA, AB, BC, CD) are expected to conform to specific Fibonacci retracement and extension levels. The precision of these levels is key to the pattern's validity and its predictive power. While minor deviations are acceptable, the closer the actual price movements align with the ideal Fibonacci ratios, the more reliable the pattern is considered. Many traders utilize the Gartley pattern not in isolation, but in conjunction with other technical indicators or chart patterns to confirm signals and enhance the probability of successful trades. It can offer a broader perspective on potential long-term price direction, while traders might focus on shorter-term execution within that overarching trend.
How to identify the Gartley Harmonic Pattern
Identifying a Gartley pattern requires a keen eye for its specific structure and a solid understanding of Fibonacci relationships. The pattern consists of five distinct points (X, A, B, C, D) that form four significant price legs. The visual appearance is often described as an 'M' for bullish Gartley patterns (where point D is a potential buy point) and a 'W' for bearish Gartley patterns (where point D is a potential sell point).
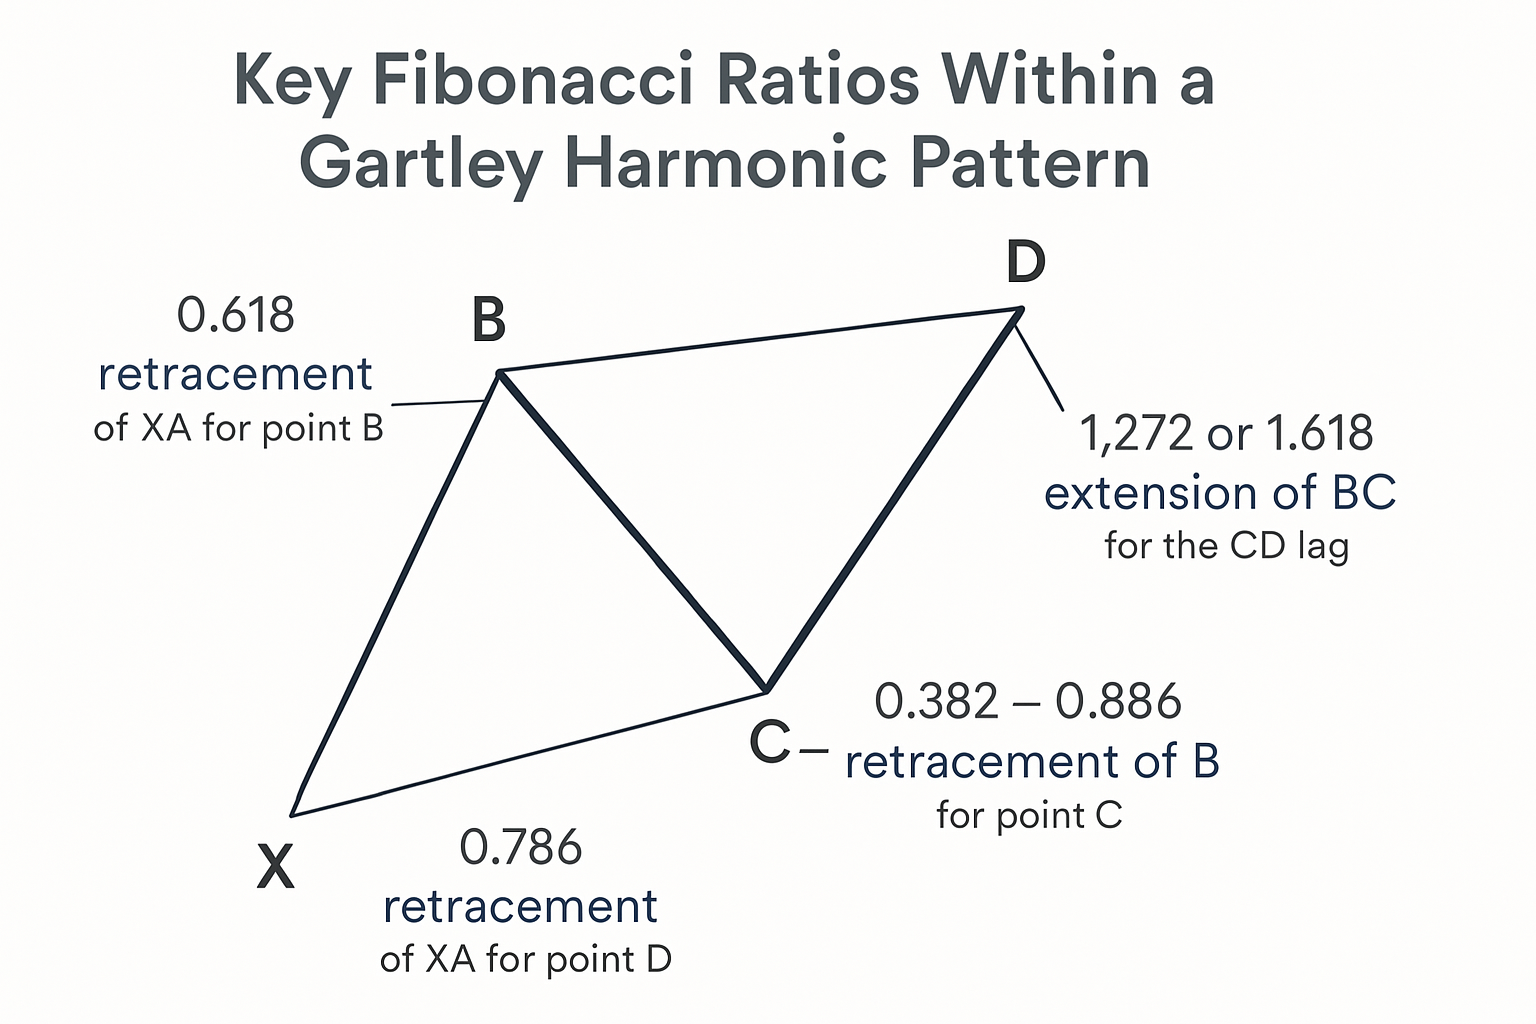
The critical Fibonacci ratios that define a "perfect" Gartley pattern are as follows:
- Point B Retracement: The AB leg should retrace approximately 0.618 (61.8%) of the initial XA leg. This is a crucial anchor point for the pattern.
- Point C Retracement: The BC leg should then retrace between 0.382 (38.2%) and 0.886 (88.6%) of the preceding AB leg.
- Point D Completion - CD Leg Extension/Retracement:
- If the BC leg retraced to 0.382 of AB, then the CD leg should be a 1.272 extension of the BC leg.
- If the BC leg retraced to 0.886 of AB, then the CD leg should be a 1.618 extension of the BC leg.
- Point D Retracement of XA: Crucially, the completion point D should represent a 0.786 (78.6%) retracement of the entire initial XA leg. This D point is known as the Potential Reversal Zone (PRZ).
To practically identify the pattern, traders typically use Fibonacci drawing tools available on most charting platforms. They would first identify a significant impulse leg (XA). Then, they would look for a retracement to point B, followed by a counter-move to point C, and finally the completion at point D. Each of these points and legs must satisfy the specified Fibonacci criteria. For a bullish Gartley, X is a swing low, A is a swing high, B is a retracement low, C is a higher high than B but lower than A, and D is a higher low than X, forming the PRZ for a potential upward move. Conversely, for a bearish Gartley, X is a swing high, A is a swing low, B is a retracement high, C is a lower low than B but higher than A, and D is a lower high than X, forming the PRZ for a potential downward move. The convergence of these Fibonacci levels at point D is what gives the pattern its strength.
Bullish Gartley Pattern Example
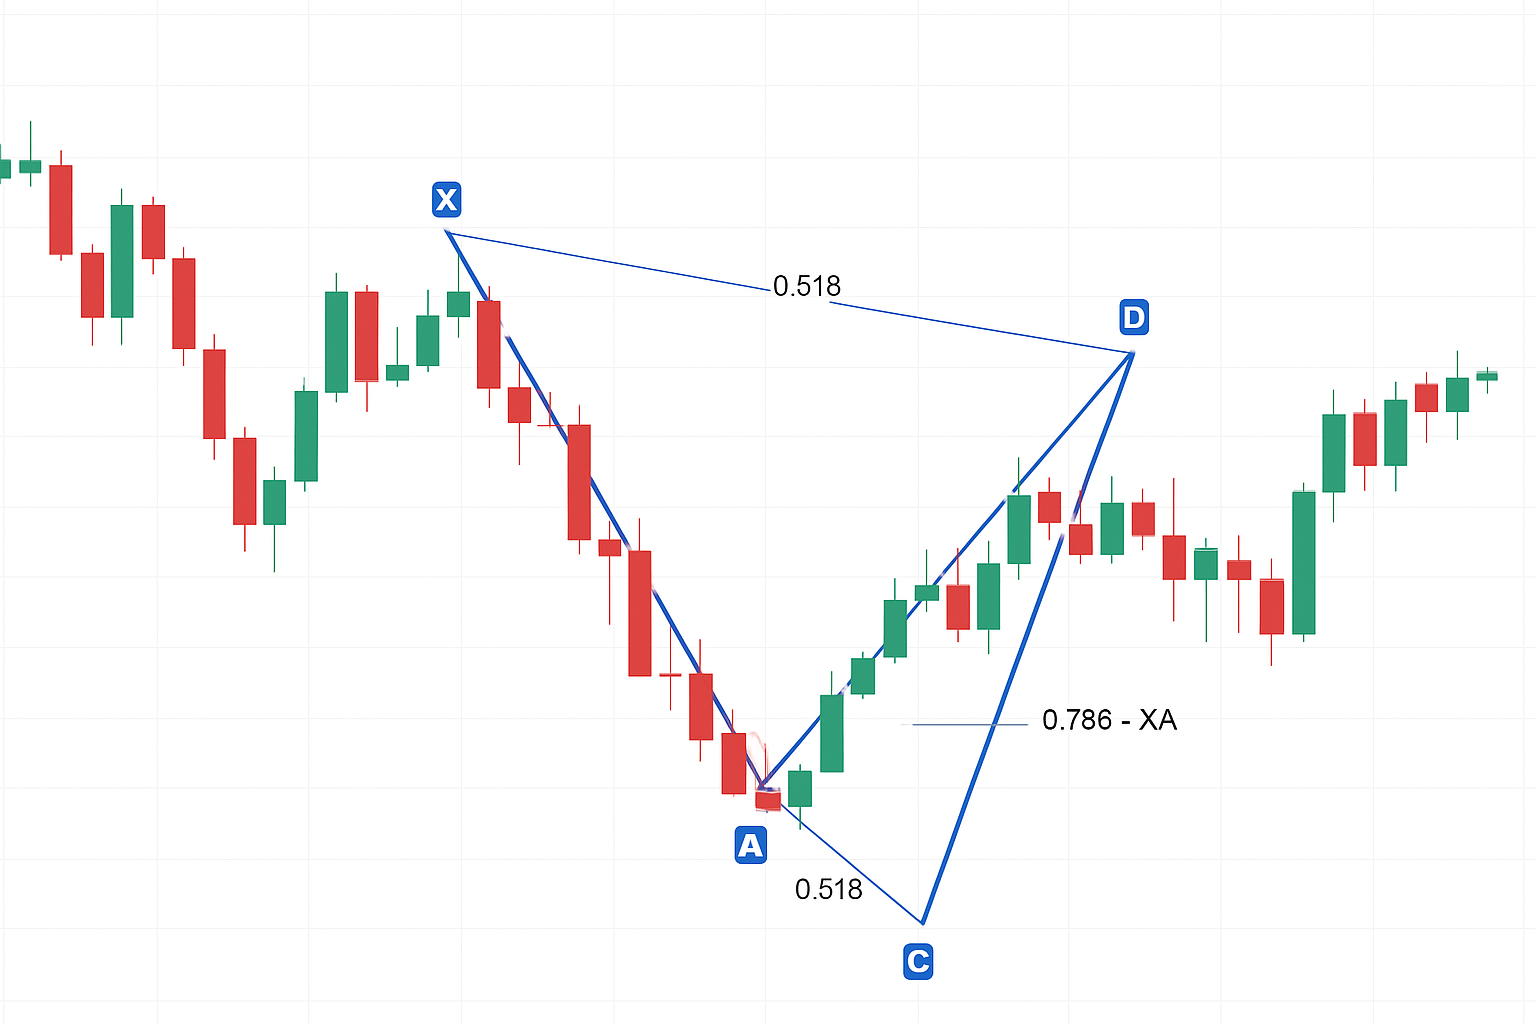
Below is an example of a Bullish Gartley pattern forming on a candlestick chart. Notice how the price reacts upwards after completing at point D, which aligns with the expected Fibonacci levels.
Bearish Gartley Pattern Example
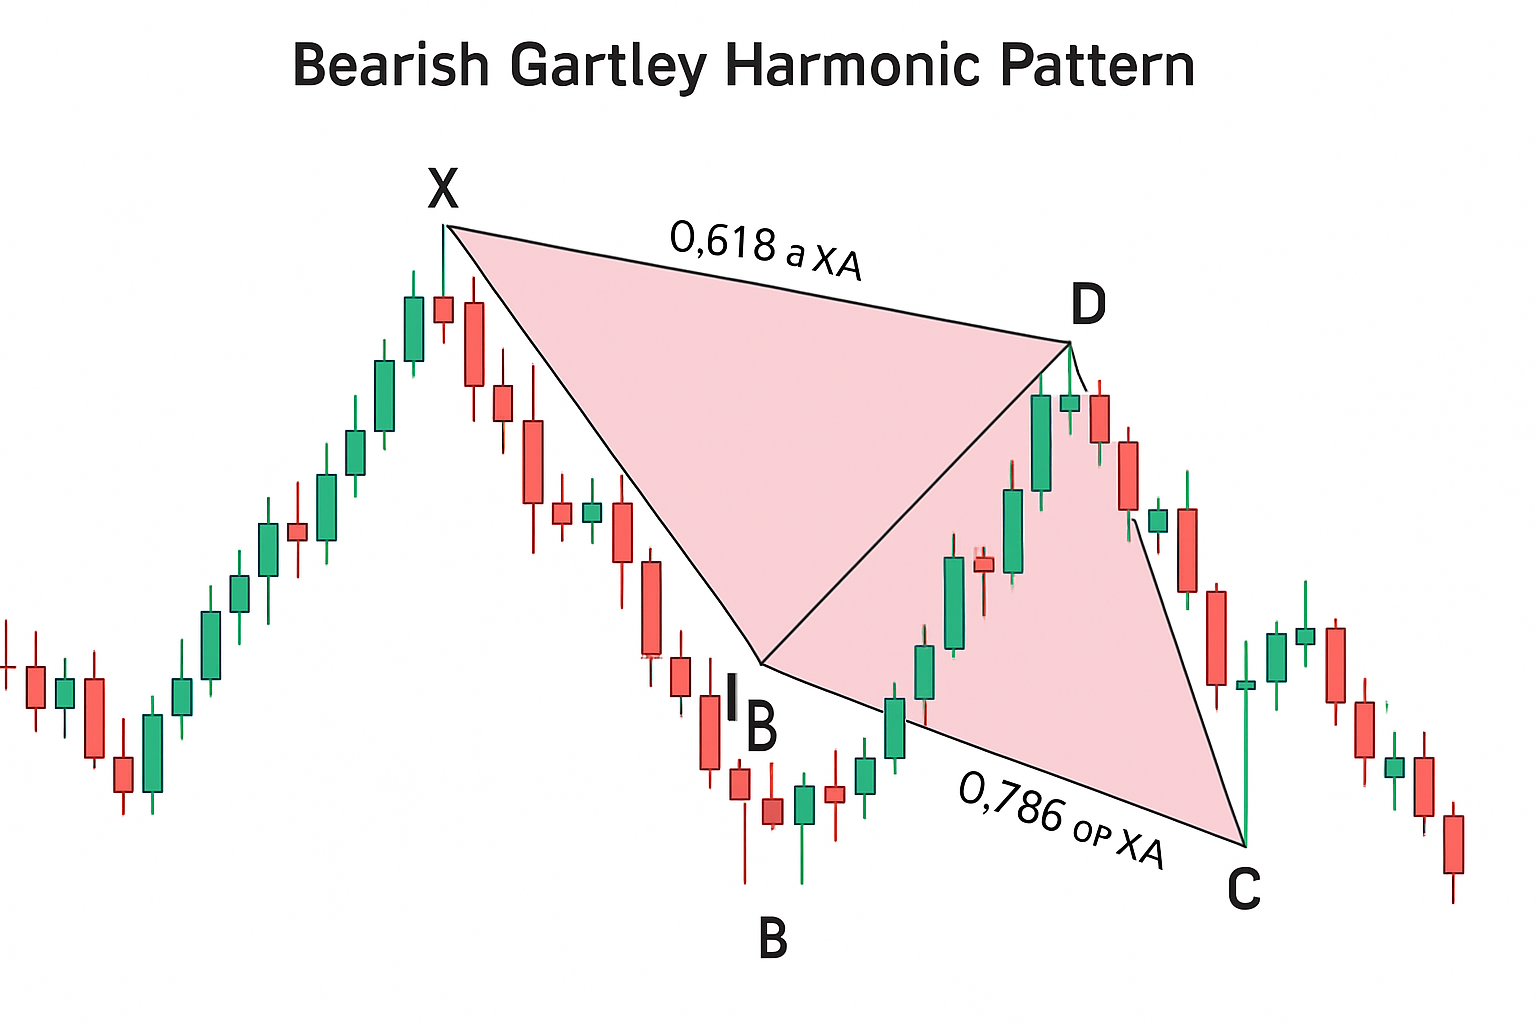
Conversely, a Bearish Gartley pattern signals a potential downward move from point D. The structure is an inverted 'M' or 'W' shape, with specific Fibonacci confluences indicating the PRZ.
How to trade the Gartley Harmonic Pattern
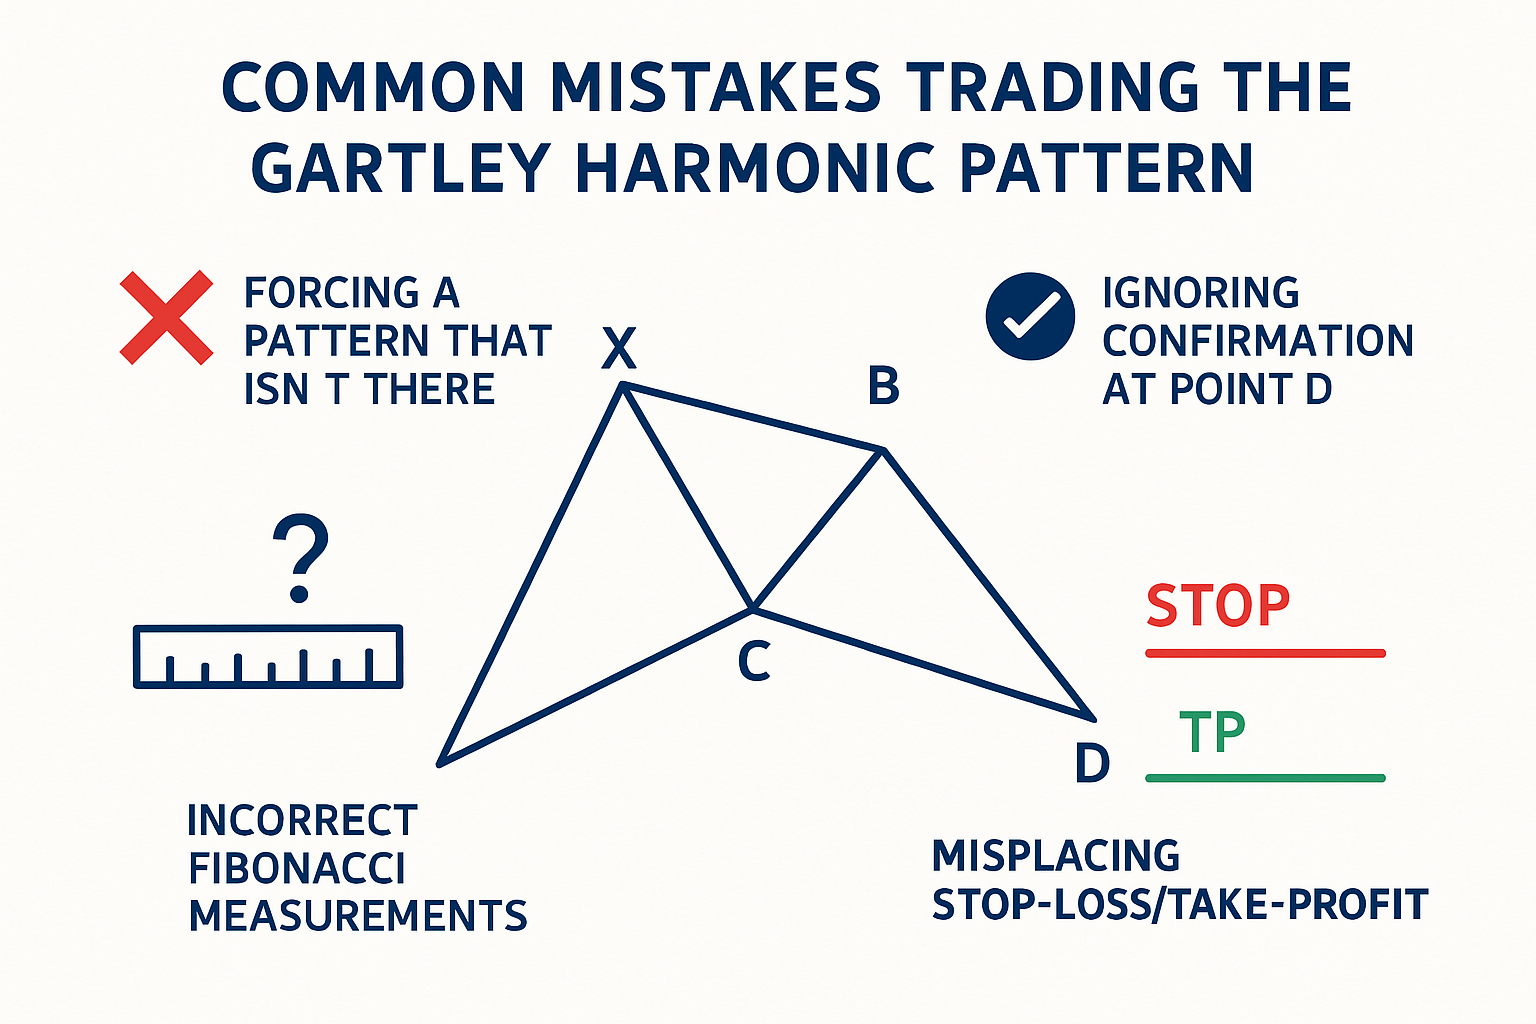
Trading the Gartley pattern involves waiting for the pattern to complete at point D, which signifies the Potential Reversal Zone (PRZ). Once point D is identified and the pattern's Fibonacci ratios are confirmed, traders look for signs of price reversal in this zone before entering a trade. It's generally not advisable to enter a trade simply because price has reached the D point; confirmation is key.
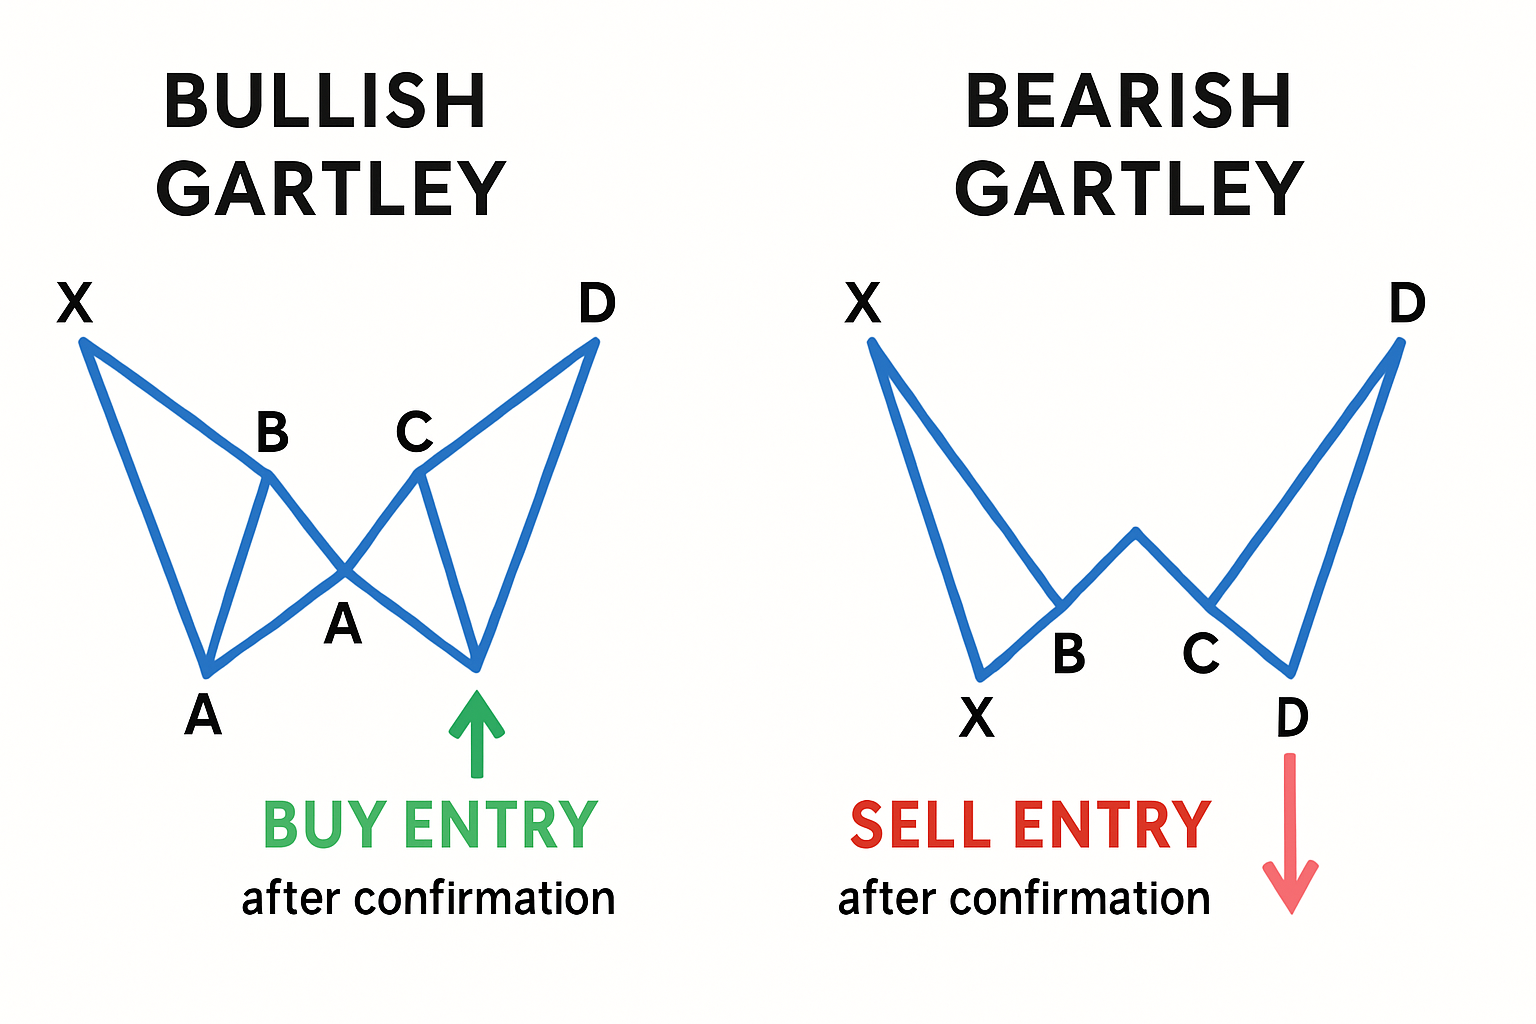
Entry Strategy: For a bullish Gartley, traders will look to enter a long (buy) position once the price shows signs of rejecting the PRZ at point D and starting to move upwards. This confirmation can come from candlestick patterns (e.g., a bullish engulfing, hammer, or doji followed by a bullish candle), a break above a short-term resistance level formed around the D point, or divergence on an oscillator like the RSI or MACD. For a bearish Gartley, traders will look to enter a short (sell) position once the price shows signs of rejecting the PRZ at point D and starting to move downwards. Confirmation signals would be the bearish equivalents of the bullish scenario (e.g., bearish engulfing, shooting star, or bearish divergence).
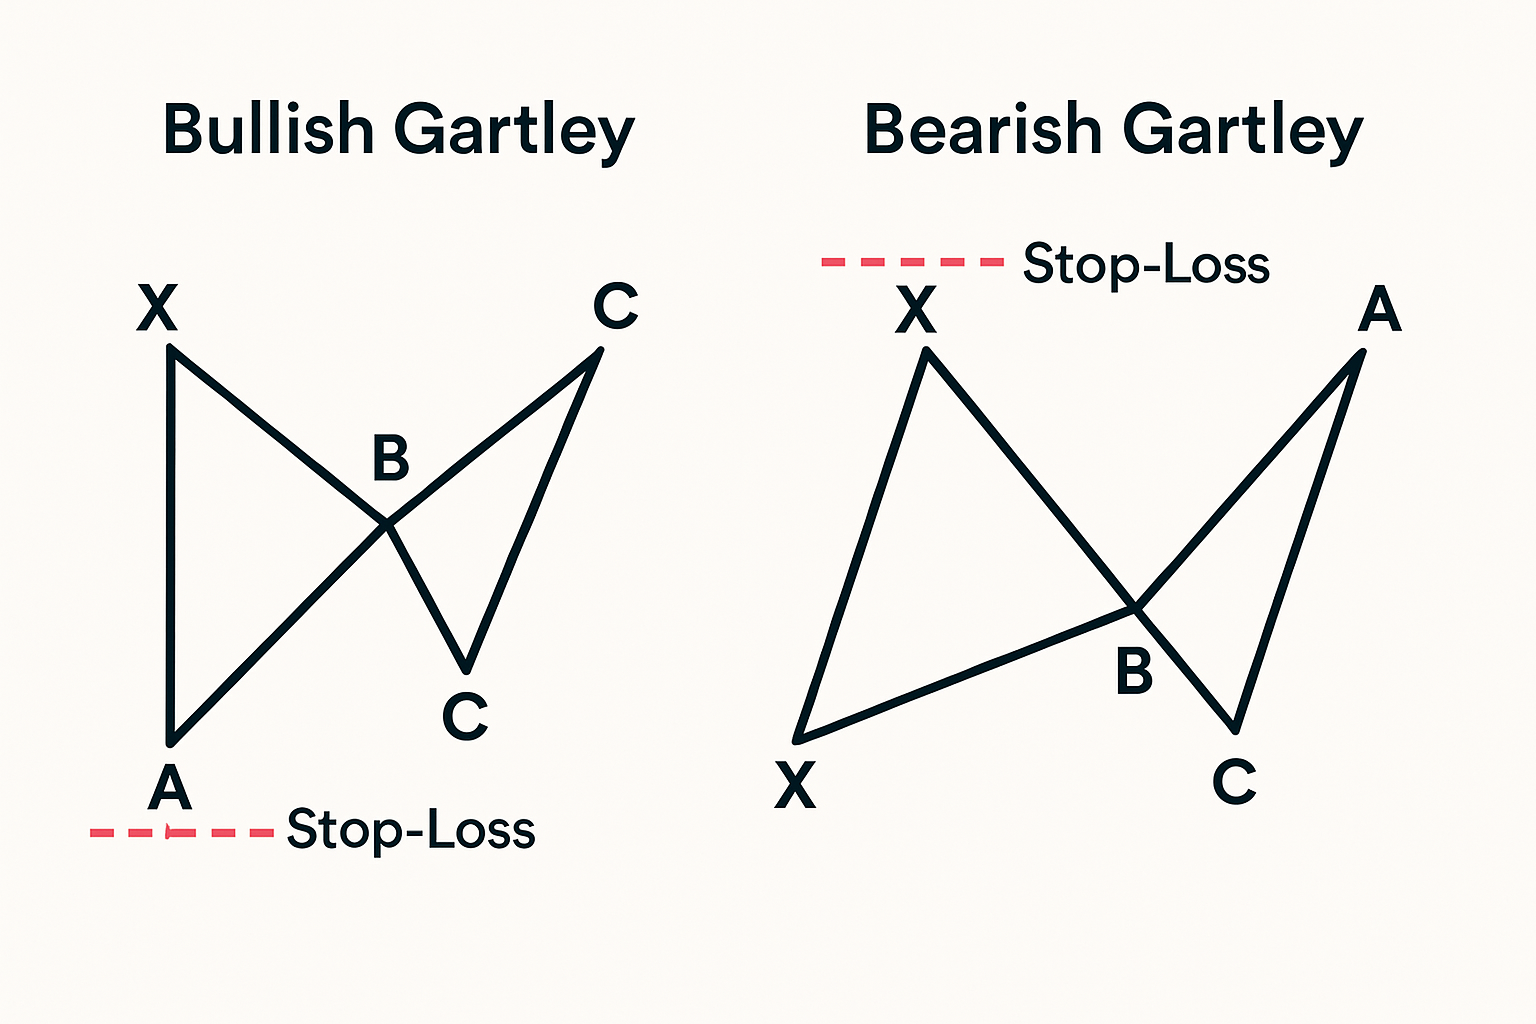
Stop-Loss Placement: A critical aspect of trading any pattern is risk management. For a Gartley pattern, the stop-loss is typically placed just beyond the X point. If point X is breached, the pattern is considered invalidated. Some traders might opt for a tighter stop, placing it just beyond the D point or a structure level slightly beyond D, but placing it beyond X offers more room for volatility while respecting the pattern's overall structure.
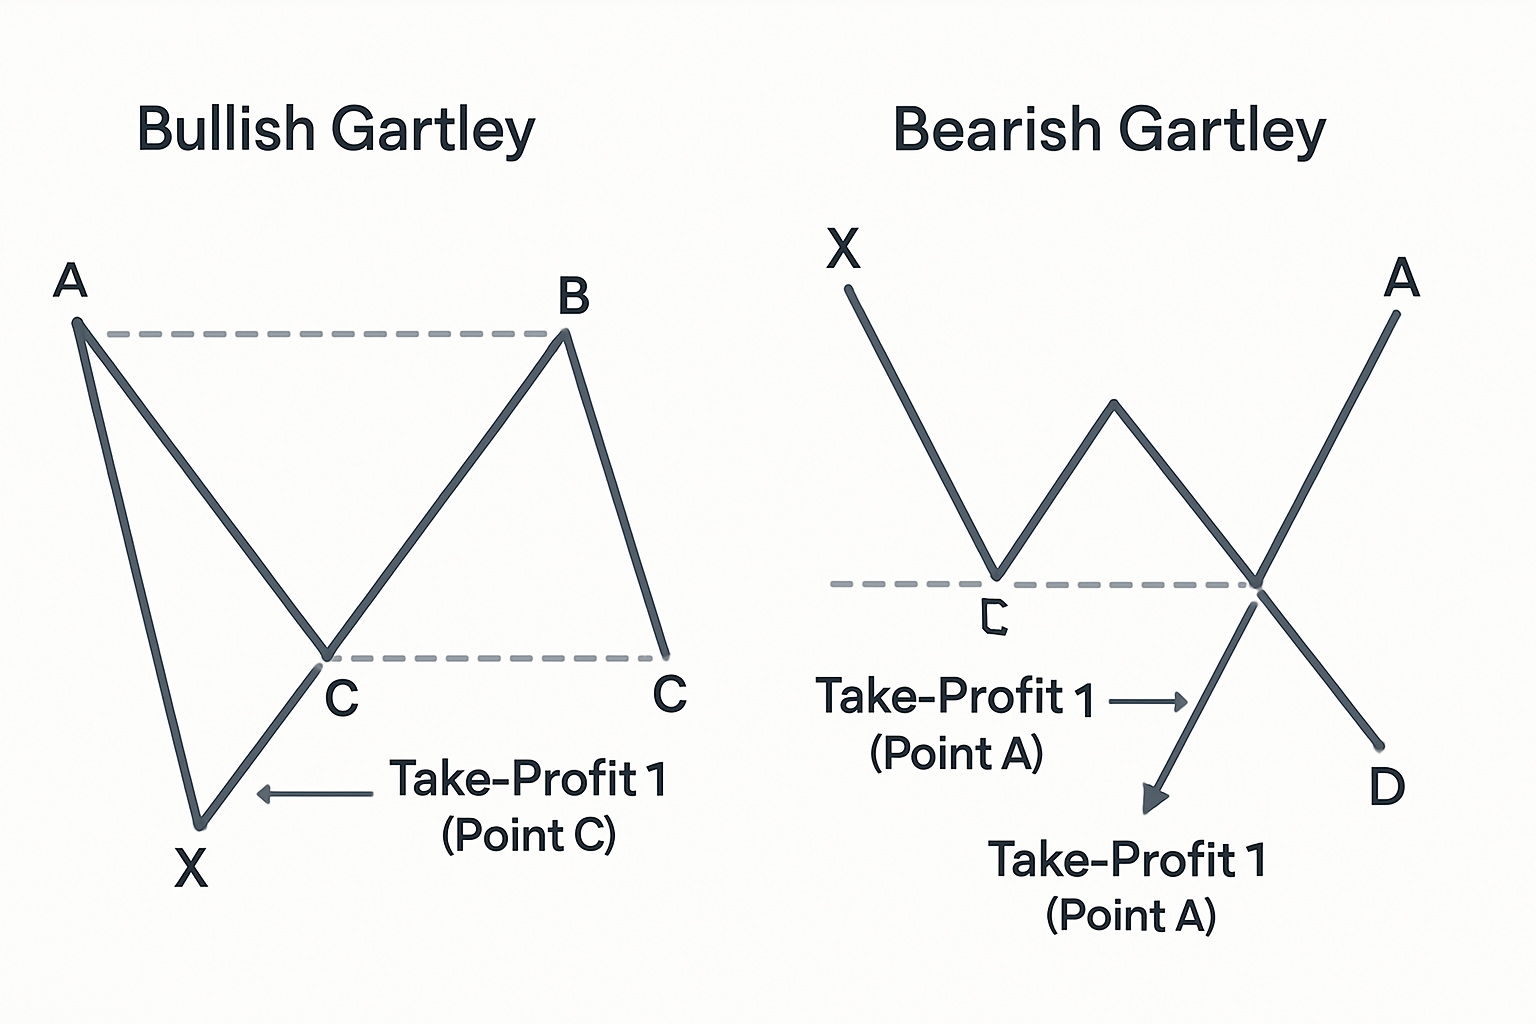
Take-Profit Targets: Take-profit targets for Gartley patterns are often based on Fibonacci levels derived from the pattern itself. Common targets include:
- Target 1: Point C of the pattern. This is often the most conservative first target.
- Target 2: Point A of the pattern. This is a more significant target.
- Further Targets: Fibonacci extensions of the XA leg or the AD leg can also be used for subsequent profit targets, such as the 1.272 or 1.618 extension of the AD move from D.
Traders often use a multi-target approach, scaling out of their position as each target is reached, and potentially moving their stop-loss to breakeven or trailing it to lock in profits. It's important to remember that, like all technical patterns, the Gartley is not foolproof. It should be used as part of a broader trading plan that includes sound risk management principles and, ideally, confluence with other analytical tools or market context.
FAQ
What is the Gartley Pattern?
The Gartley is a 5-point harmonic reversal pattern that uses Fibonacci ratios to identify potential turning points. It helps traders anticipate where a trend might exhaust and reverse, offering defined entry, stop, and target levels.
Can you trade the Gartley Pattern by itself?
While the Gartley provides a strong framework, it's best used with other confirming signals like candlestick patterns or indicators. Relying solely on any single pattern can increase risk in trading.
Is the Gartley Pattern reliable in all markets and timeframes?
The Gartley pattern can appear in any market (forex, stocks, crypto) and across various timeframes. However, its reliability can be enhanced by considering the broader market context and volatility of the specific timeframe.