Shark Harmonic Pattern
The Shark Harmonic Pattern is a powerful price reversal formation that helps traders identify potential market turning points with remarkable accuracy. Discovered by Scott Carney in 2011, this pattern utilizes specific Fibonacci ratios to predict high-probability reversal zones.
What is the Shark Harmonic Pattern?
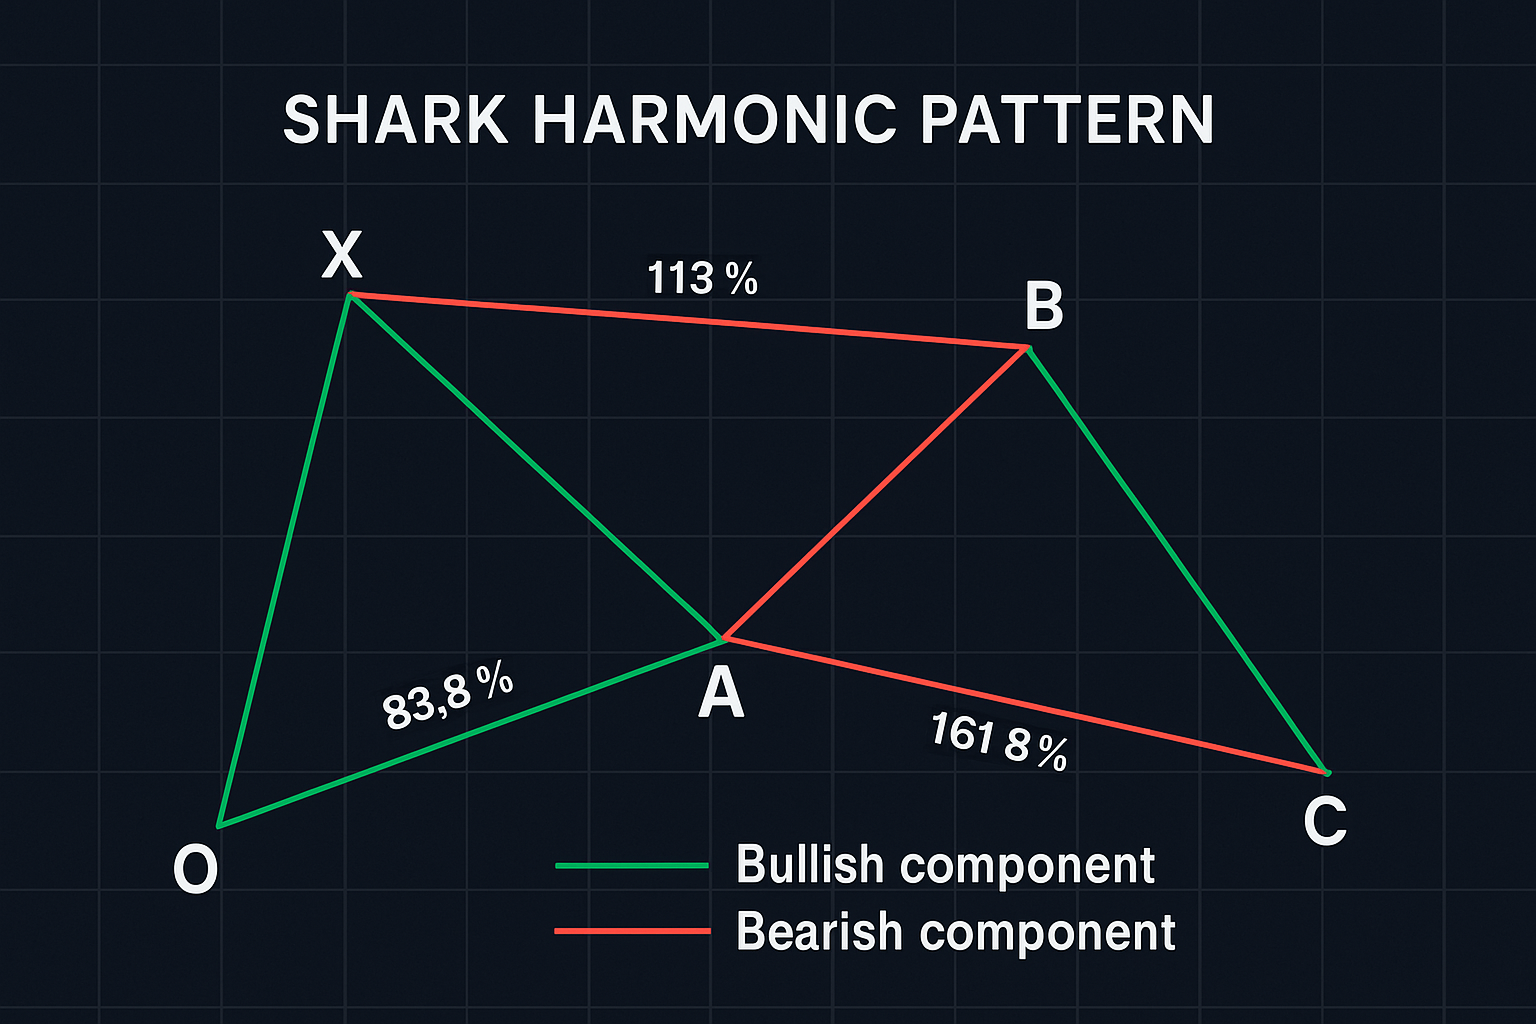
The Shark Harmonic Pattern is a five-point reversal structure that differs from traditional harmonic patterns like the Gartley or Butterfly. Unlike the typical M and W frameworks of other harmonic patterns, the Shark pattern features a unique formation called an "Extreme Harmonic Impulse Wave" that retests defined support/resistance levels while converging in the area of the 0.886 retracement and 1.13 extension.
This pattern is characterized by its aggressive nature and ability to capture sharp market reversals. The Shark pattern often precedes the 5-0 harmonic pattern and represents a temporary extreme structure that capitalizes on extended price movements.
Key Components of the Shark Pattern
The Shark pattern consists of five key swing points, labeled differently than traditional harmonic patterns:
- Point O: The initial starting point of the pattern
- Point X: The first reversal point after the initial move
- Point A: The second reversal point, creating a retracement of the OX leg
- Point B: The third reversal point, extending beyond point X
- Point C: The completion point where traders look to enter positions
Fibonacci Ratios in the Shark Pattern
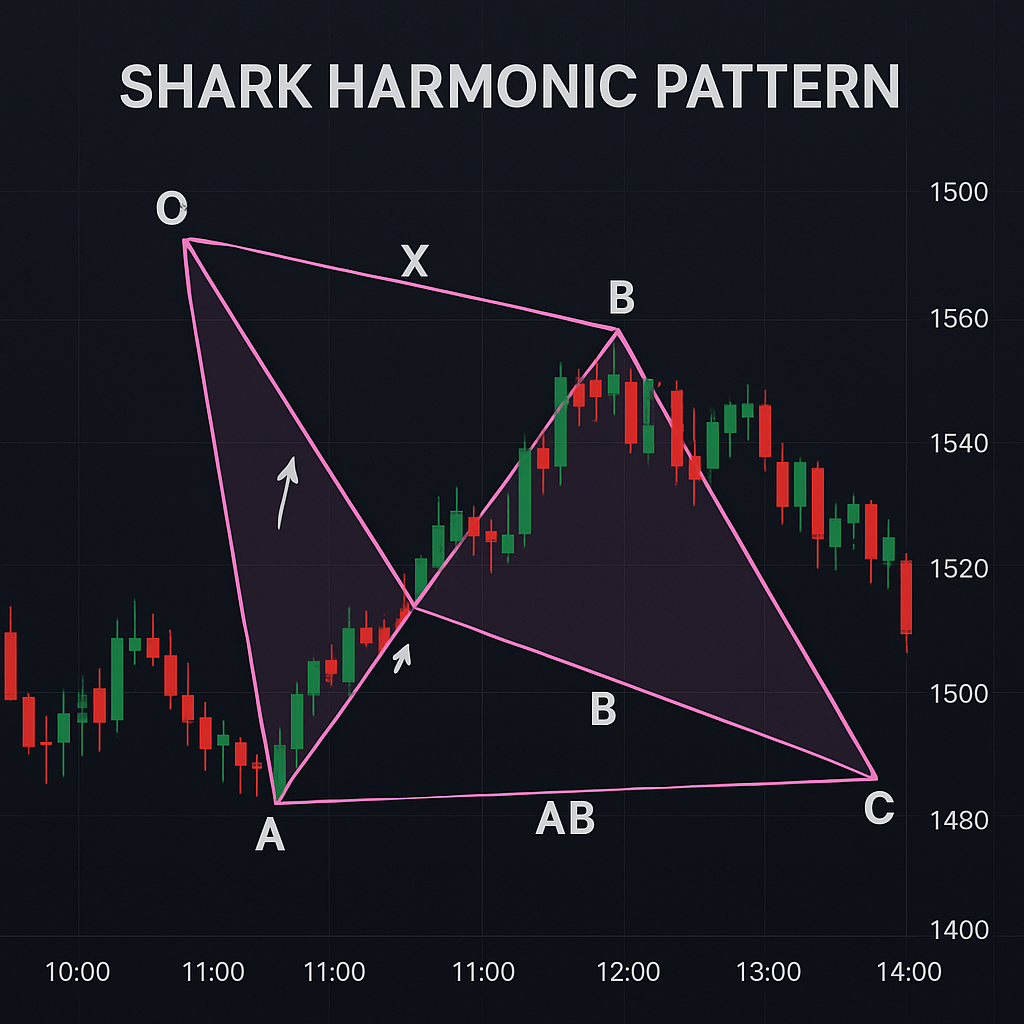
What makes the Shark pattern unique is its reliance on specific Fibonacci ratios:
- The AB leg extends beyond point X, typically by 113% to 161.8% of the XA leg
- The BC leg retraces to the 88.6% to 113% zone of the OX leg
- The BC leg typically extends 161.8% to 224% of the AB leg
The 88.6% retracement is particularly significant in the Shark pattern and serves as a minimum requirement for pattern validation. This specific ratio, combined with the 1.13 extension, creates a powerful reversal zone that often leads to sharp price reactions.
How to Identify the Shark Harmonic Pattern
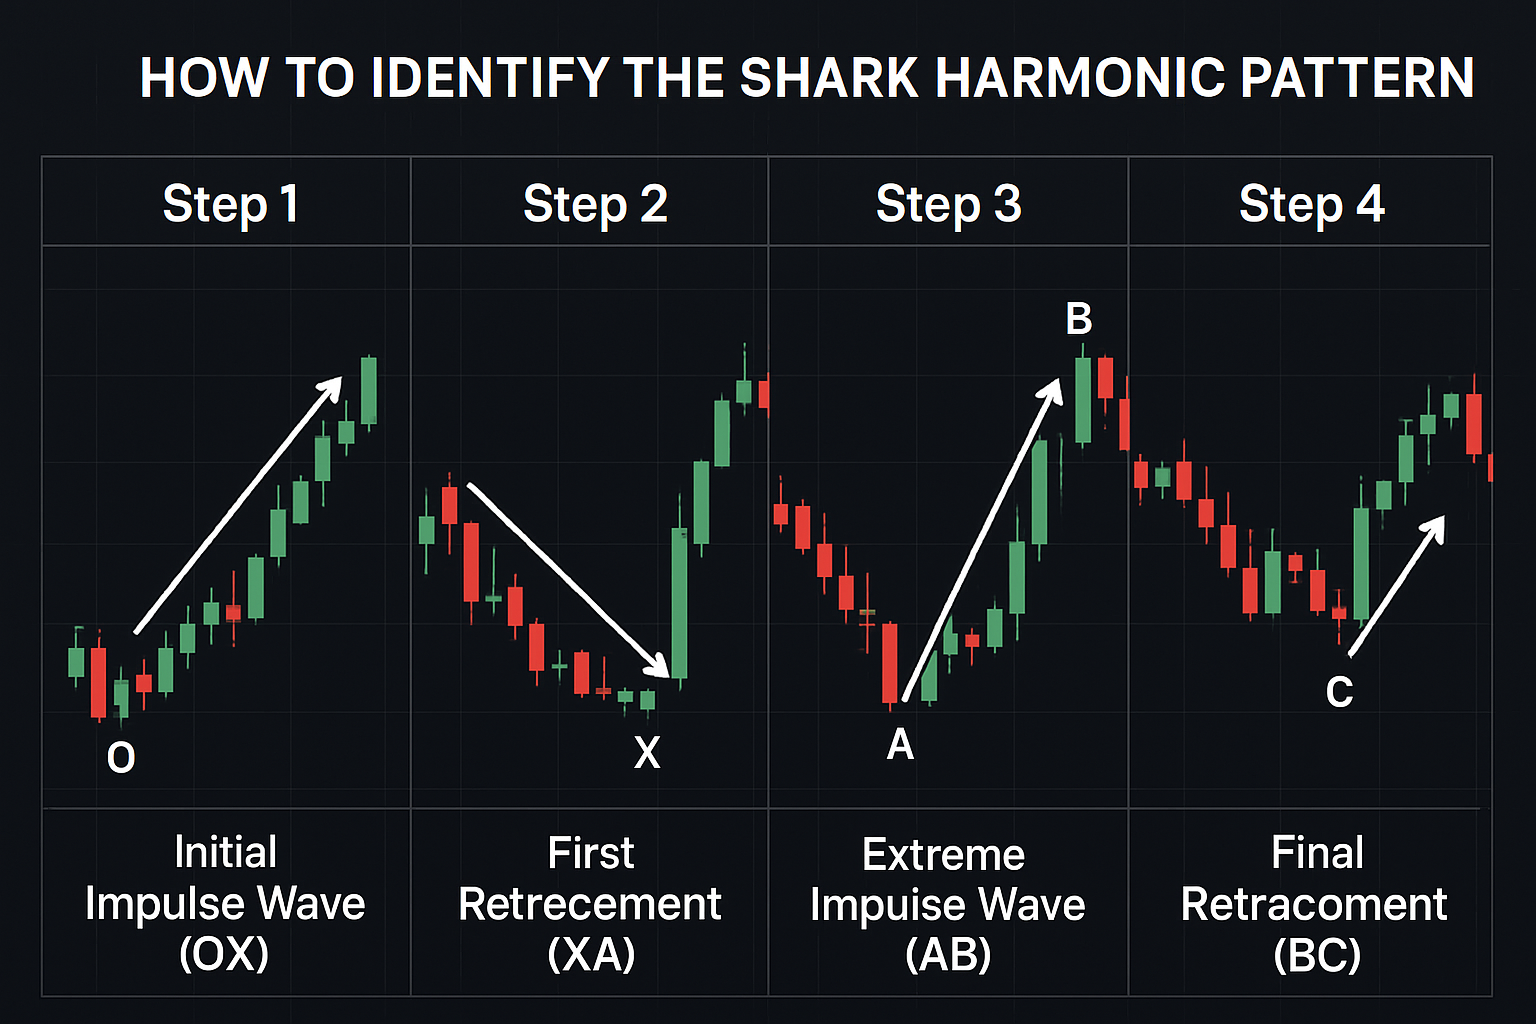
Identifying the Shark pattern requires attention to detail and a solid understanding of Fibonacci relationships. Here's a step-by-step approach to spotting this pattern on your charts:
Step 1: Identify the Initial Impulse Wave (OX)
The pattern begins with a clear directional move that establishes the trend direction. This initial leg (OX) sets the foundation for the entire pattern.
Step 2: Look for the First Retracement (XA)
After the initial impulse, price retraces partially. The XA leg can retrace anywhere between points O and X but should not move beyond point O.
Step 3: Identify the Extreme Impulse Wave (AB)
The AB leg is critical as it moves beyond point X, creating what Carney calls the "Extreme Harmonic Impulse Wave." This leg should extend 113% to 161.8% of the XA leg.
Step 4: Confirm the Final Retracement (BC)
The BC leg is where the pattern completes and provides the trading opportunity. This leg should retrace to the 88.6% to 113% zone of the OX leg and typically extends 161.8% to 224% of the AB leg.
Bullish Shark Pattern
A bullish Shark pattern forms during a downtrend and signals a potential reversal to the upside. The pattern appears inverted compared to the bearish version:
- OX: Initial downward move
- XA: Upward retracement
- AB: Downward move extending beyond point X
- BC: Final upward move to the 88.6%-113% retracement of OX
Traders look to enter long positions at point C, anticipating an upward price movement.
Bearish Shark Pattern
A bearish Shark pattern forms during an uptrend and signals a potential reversal to the downside:
- OX: Initial upward move
- XA: Downward retracement
- AB: Upward move extending beyond point X
- BC: Final downward move to the 88.6%-113% retracement of OX
Traders look to enter short positions at point C, anticipating a downward price movement.
How to Trade the Shark Harmonic Pattern
Trading the Shark pattern effectively requires a disciplined approach and proper risk management. Here's a comprehensive strategy for trading this pattern:
Entry Strategies
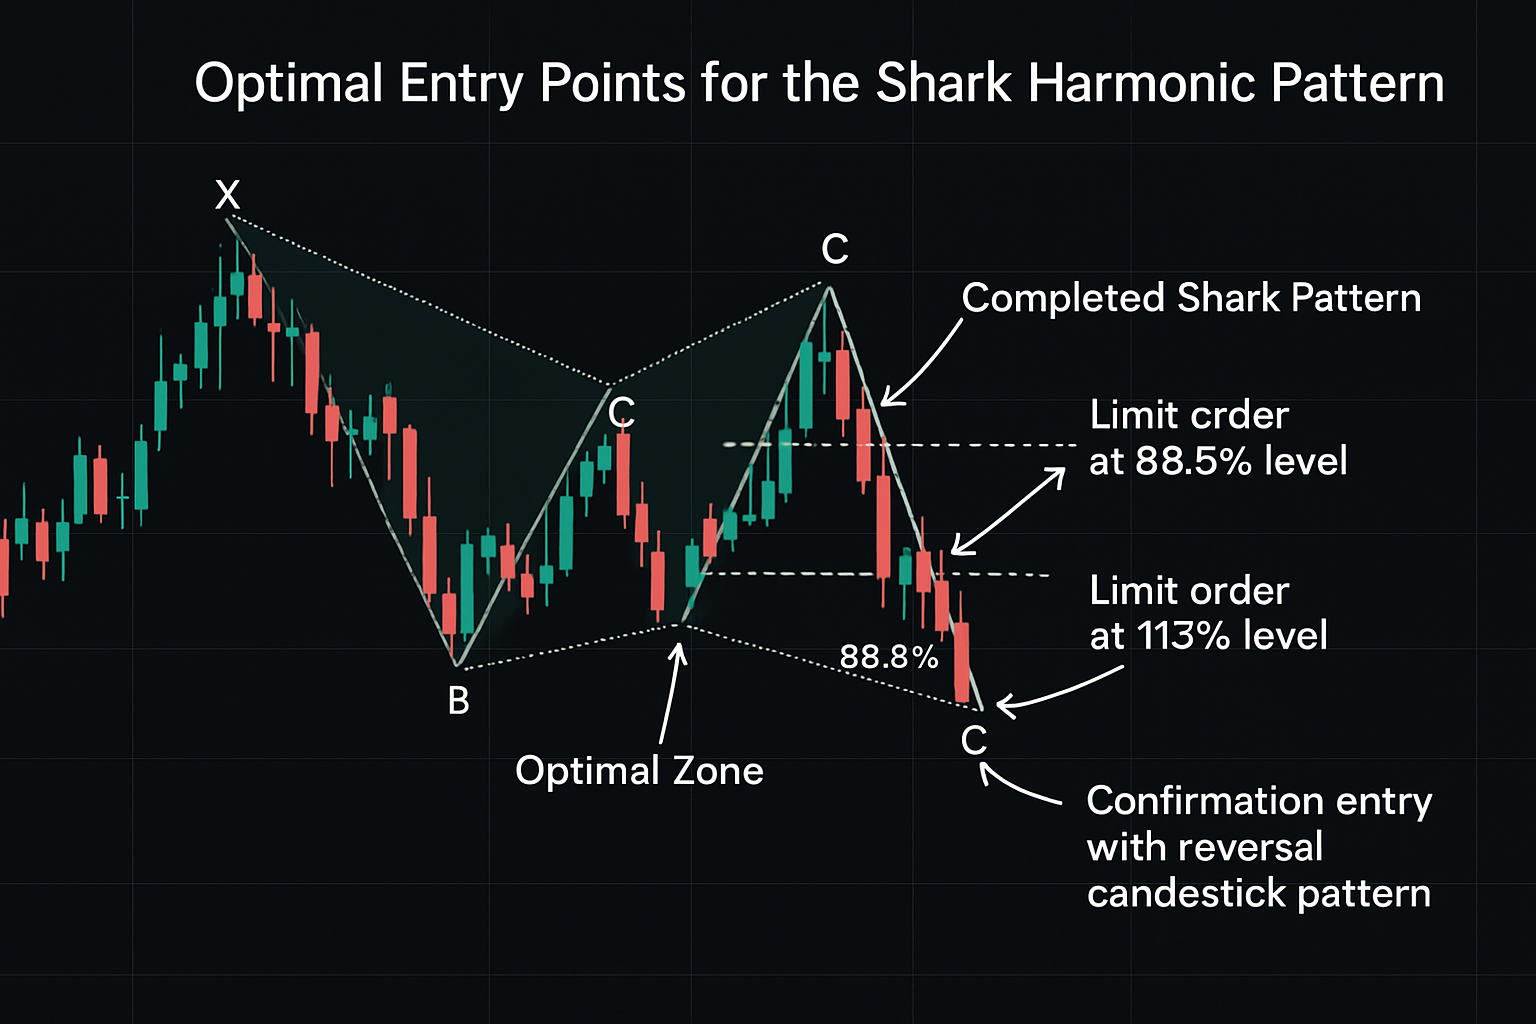
The ideal entry point for trading the Shark pattern is at point C, where the BC leg reaches the 88.6% to 113% retracement zone of the OX leg. Traders have two primary options for entry:
- Limit Order Entry: Place a limit order at the projected 88.6% or 113% retracement level before price reaches it.
- Confirmation Entry: Wait for a confirmation signal (such as a reversal candlestick pattern or indicator divergence) before entering with a market order.
Stop Loss Placement
Proper stop loss placement is crucial when trading the Shark pattern due to its aggressive nature. Consider these approaches:
- Beyond Point C: Place your stop loss just beyond point C (above for bearish patterns, below for bullish patterns).
- Percentage-Based: Set your stop loss at 115% retracement of the OX leg, which invalidates the pattern.
- Volatility-Based: Use the Average True Range (ATR) to determine an appropriate stop loss distance based on current market volatility.
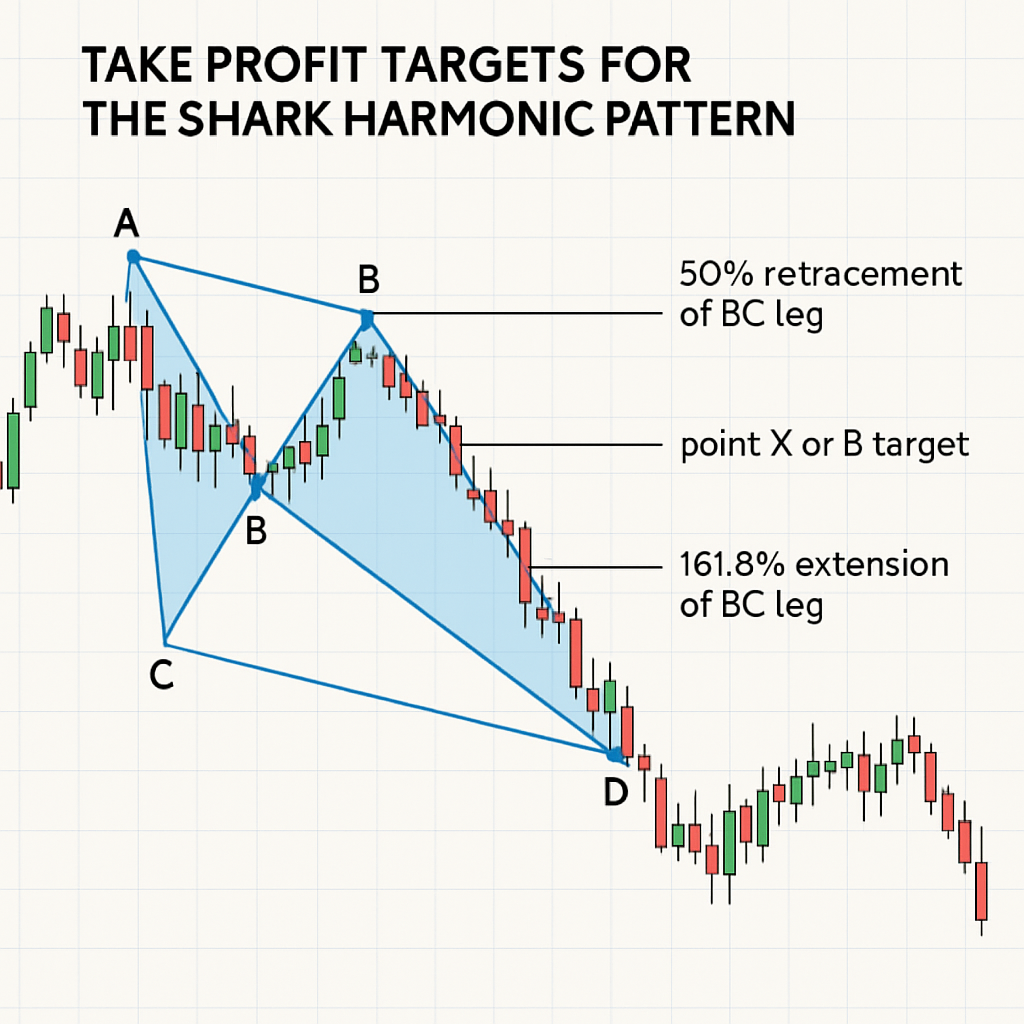
Take Profit Targets
The Shark pattern typically produces sharp but sometimes limited reversals. Consider these take profit levels:
- First Target: 50% retracement of the BC leg
- Second Target: 61.8% retracement of the BC leg
- Third Target: Point X or B, depending on the strength of the reversal
- Extended Target: 161.8% extension of the BC leg (for stronger reversals)
Risk Management Considerations
The Shark pattern often produces sharp but short-lived reversals, requiring active trade management:
- Partial Profit Taking: Consider closing portions of your position at different profit targets.
- Trailing Stops: Implement trailing stops after the first target is reached to protect profits while allowing for extended moves.
- Risk-Reward Ratio: Aim for a minimum risk-reward ratio of 1:2 for each trade.
- Position Sizing: Limit risk to 1-2% of your trading capital per trade.
Using TradingView for Shark Pattern Identification
TradingView offers several tools and indicators that can help identify and trade the Shark pattern:
- Fibonacci Retracement Tool: Use this to measure the key retracement levels (88.6%, 113%, etc.).
- XABCD Pattern Tool: Available in the "Patterns" section of the drawing tools.
- Harmonic Pattern Indicators: Several custom indicators are available that can automatically detect Shark patterns.
When using TradingView's XABCD tool, remember that the labeling differs from Carney's original notation. In TradingView, X corresponds to O, A to X, B to A, C to B, and D to C in the original Shark pattern notation.
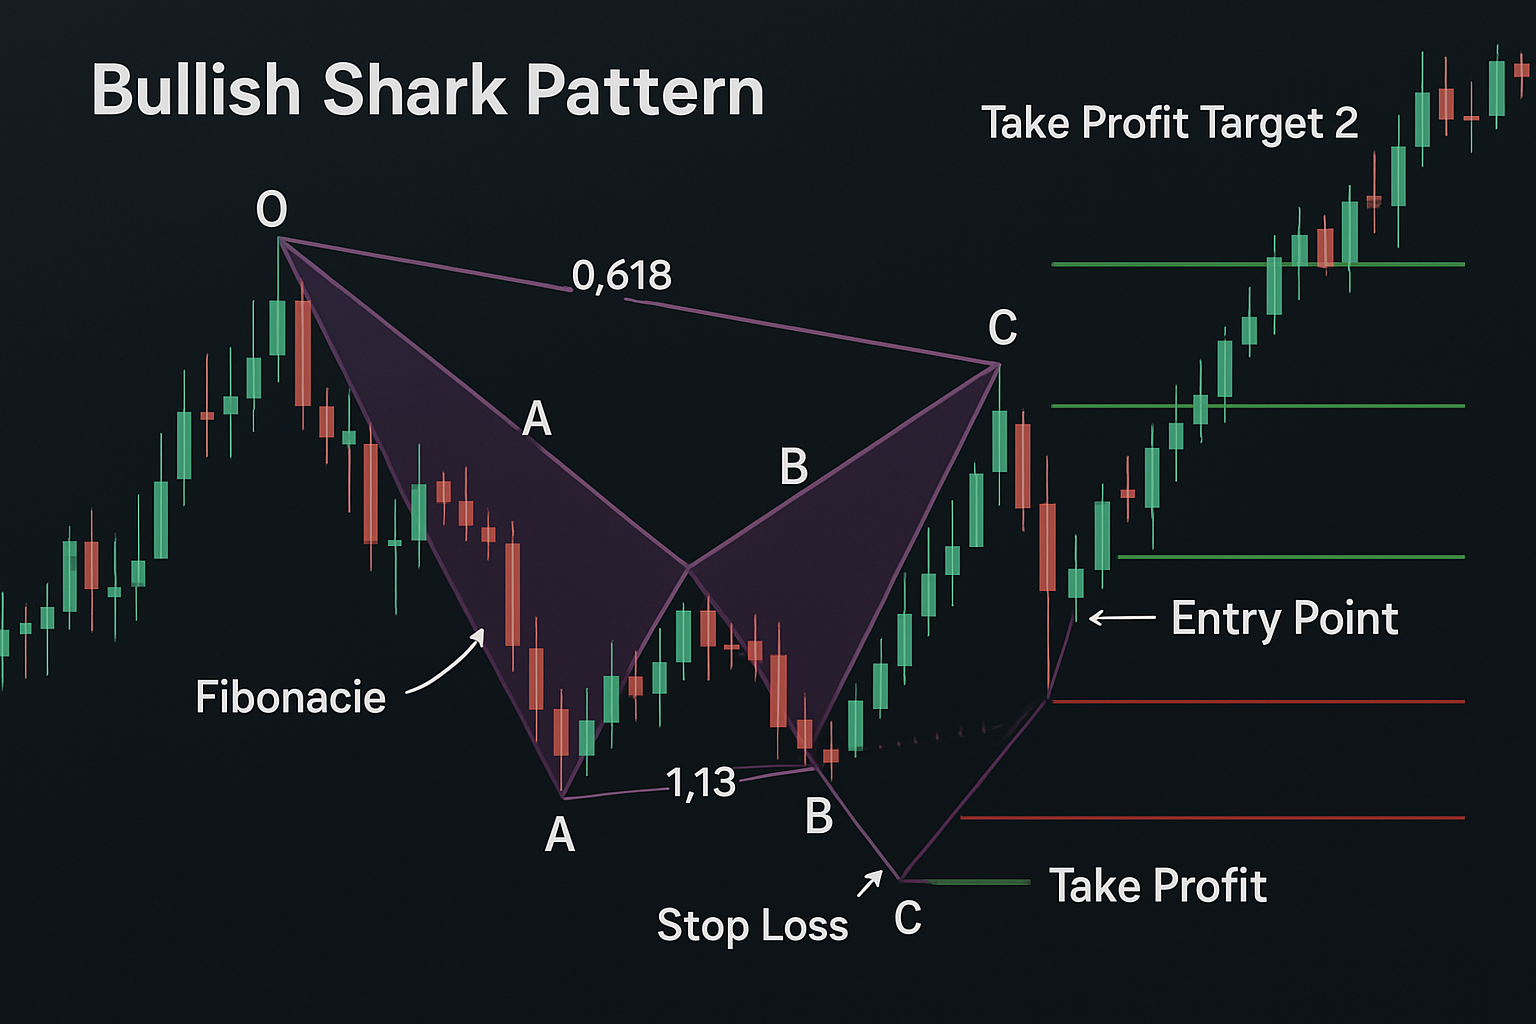
Bullish Shark Pattern Trading Strategy
Let's examine a detailed strategy for trading bullish Shark patterns:
Market Context
Bullish Shark patterns are most effective when they form after a prolonged downtrend or within a larger uptrend during a corrective phase. Look for these patterns near significant support zones or at the end of downward impulse waves.
Entry Criteria
- Confirm that all Fibonacci ratios meet the Shark pattern requirements
- Wait for a bullish confirmation signal at point C (bullish engulfing, hammer, or morning star candlestick)
- Check for bullish divergence on momentum indicators like RSI or MACD
- Enter a long position after confirmation
Stop Loss and Take Profit
- Place a stop loss 1-2% below point C or below the 113% retracement level
- Set first take profit at 50% retracement of the BC leg
- Set second take profit at 61.8% retracement of the BC leg
- Set final take profit at point B or the 161.8% extension of BC
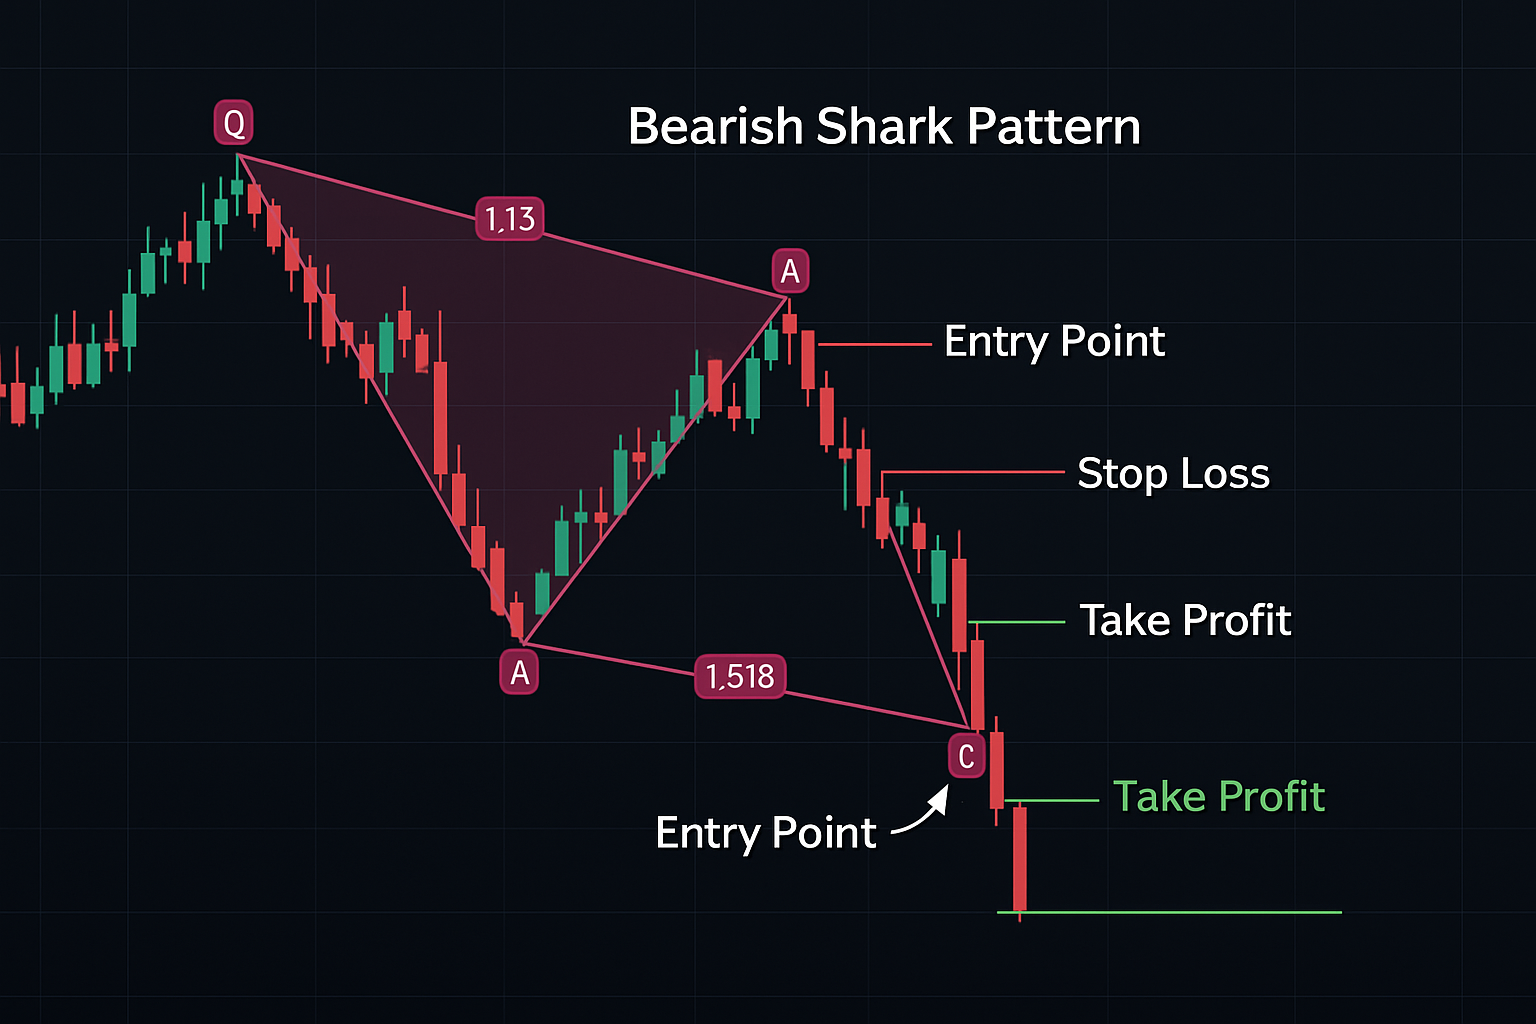
Bearish Shark Pattern Trading Strategy
Now let's examine a detailed strategy for trading bearish Shark patterns:
Market Context
Bearish Shark patterns are most effective when they form after a prolonged uptrend or within a larger downtrend during a corrective phase. Look for these patterns near significant resistance zones or at the end of upward impulse waves.
Entry Criteria
- Confirm that all Fibonacci ratios meet the Shark pattern requirements
- Wait for a bearish confirmation signal at point C (bearish engulfing, shooting star, or evening star candlestick)
- Check for bearish divergence on momentum indicators like RSI or MACD
- Enter a short position after confirmation
Stop Loss and Take Profit
- Place a stop loss 1-2% above point C or above the 113% retracement level
- Set first take profit at 50% retracement of the BC leg
- Set second take profit at 61.8% retracement of the BC leg
- Set final take profit at point B or the 161.8% extension of BC
Advanced Trading Techniques
To enhance your Shark pattern trading results, consider these advanced techniques:
Multiple Timeframe Analysis
Confirm the Shark pattern across multiple timeframes for higher probability trades:
- Identify the pattern on your primary timeframe (e.g., 4-hour chart)
- Confirm the reversal zone aligns with support/resistance on higher timeframes (daily, weekly)
- Use lower timeframes (1-hour, 15-minute) for precise entry timing
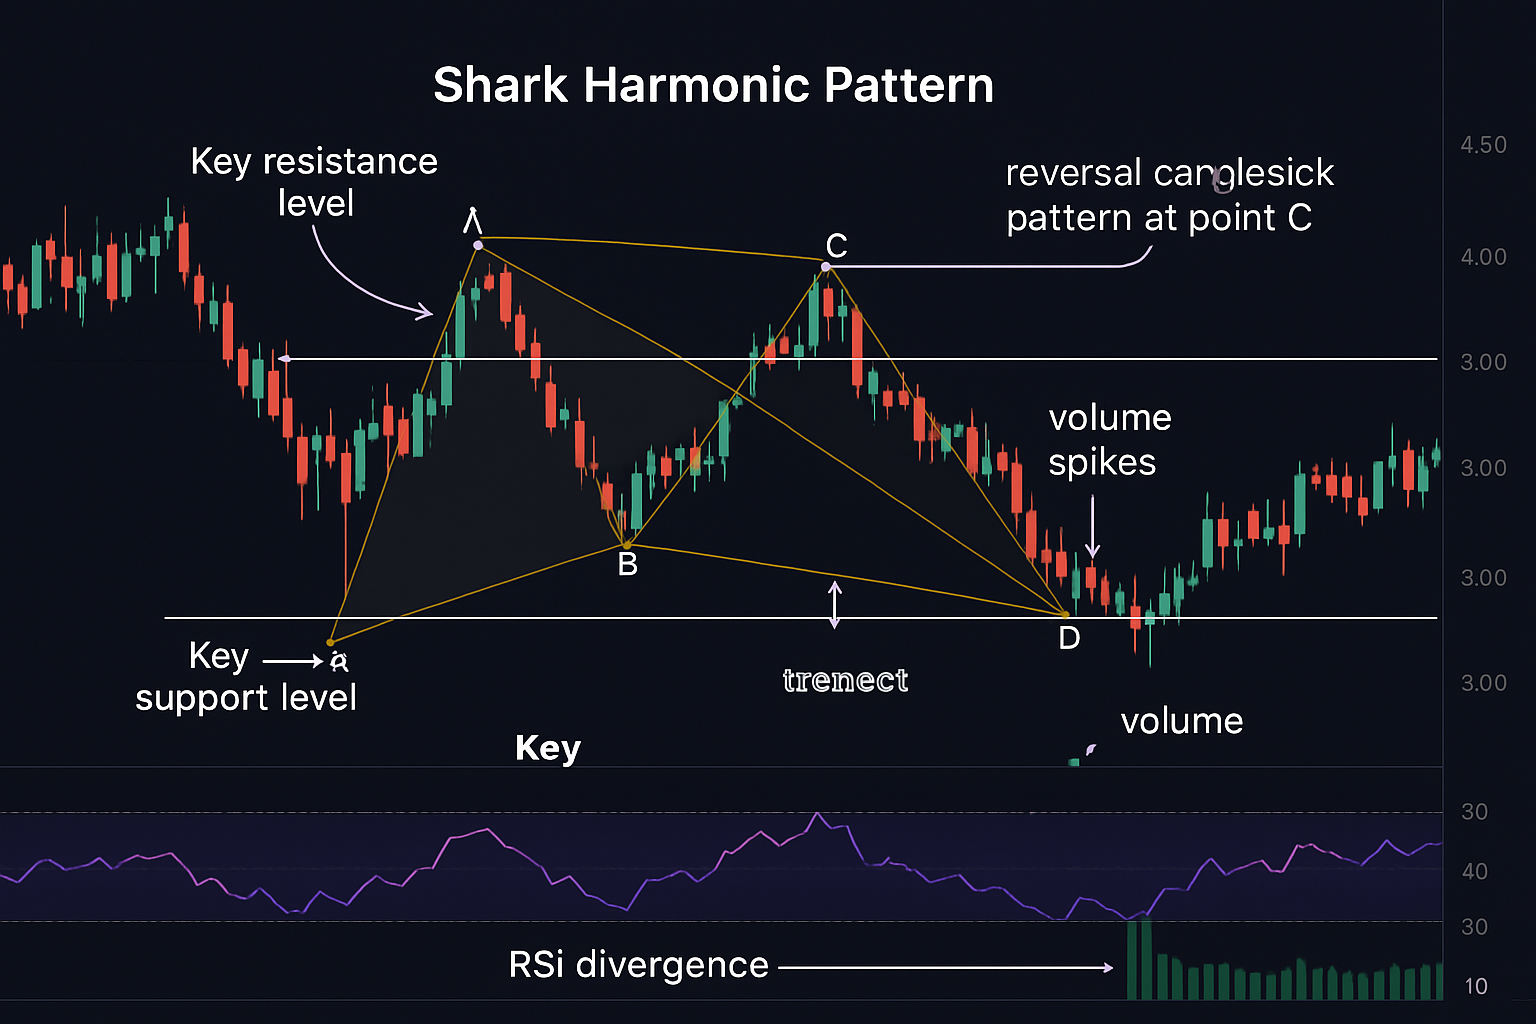
Confluence Factors
Look for additional technical factors that align with the Shark pattern completion point:
- Key support/resistance levels
- Trendline intersections
- Moving average crossovers
- Volume spikes at reversal points
- Candlestick reversal patterns
Combining with Other Indicators
Enhance your Shark pattern trading by incorporating these complementary indicators:
- Relative Strength Index (RSI): Look for divergence at point C
- Moving Average Convergence Divergence (MACD): Confirm momentum shifts
- Stochastic Oscillator: Identify overbought/oversold conditions
- Bollinger Bands: Confirm volatility expansion at reversal points
- Volume Profile: Verify significant volume at pattern completion
Common Questions
Can you trade the Shark Harmonic Pattern by itself?
No, the Shark pattern should not be traded in isolation. For optimal results, combine it with other technical analysis tools and confluence factors to increase trade probability and manage the aggressive nature of these reversals.
Can you trade the Shark Harmonic Pattern in any market?
Yes, the Shark pattern can be effectively traded across various markets including forex, stocks, commodities, and cryptocurrencies. The pattern works well in liquid markets with clear price action and defined trends.
Can you trade the Shark Harmonic Pattern in any timeframe?
Yes, the Shark pattern can be identified and traded on any timeframe, from 5-minute charts to weekly charts. However, higher timeframes (4-hour, daily) typically produce more reliable signals with better risk-reward ratios.