Fair Value Gaps Trading Strategy
Fair value gaps (FVGs) represent one of the most powerful price action concepts in modern trading. These market imbalances provide traders with high-probability entry points and clear directional bias.
What is a Fair Value Gap?
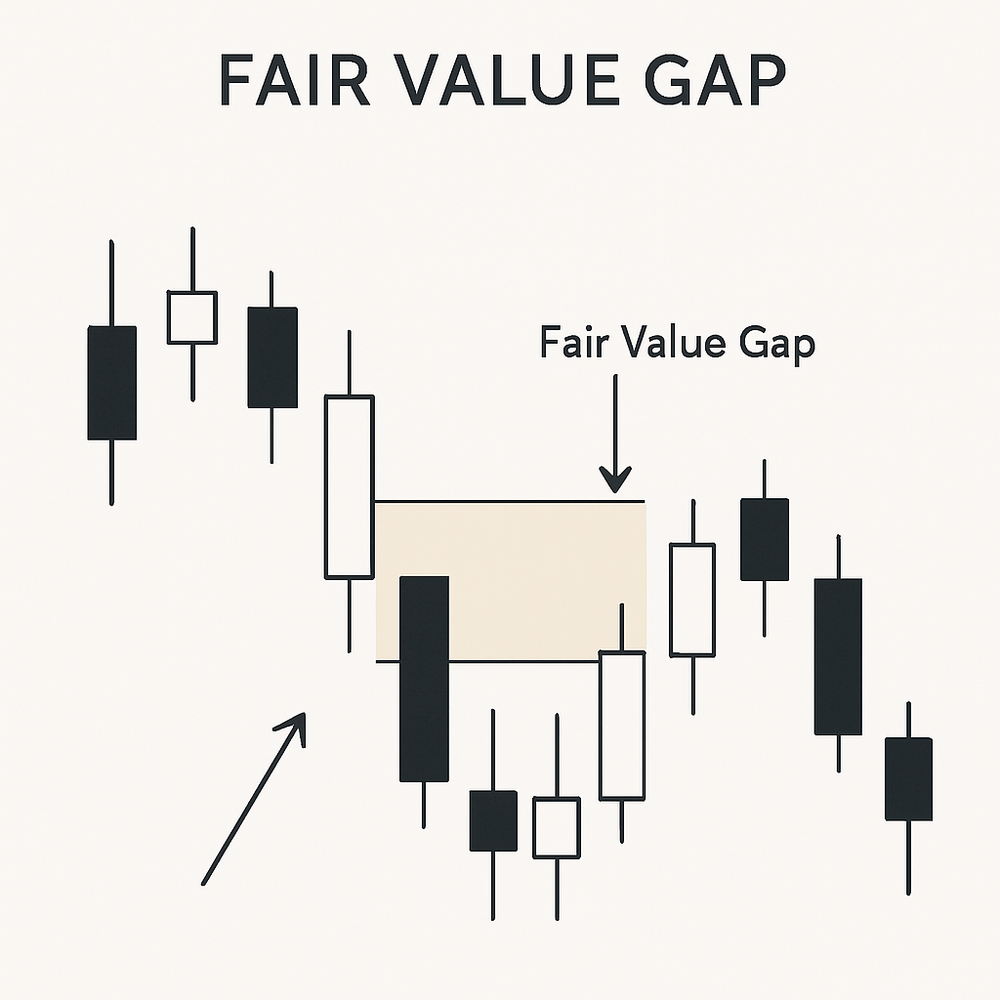
A fair value gap is a price imbalance that occurs when there's a significant disparity between buying and selling pressure in the market. Originally popularized by the Inner Circle Trader (ICT), fair value gaps identify areas where price has moved rapidly, creating inefficiencies that the market often returns to correct.
On a price chart, a fair value gap appears as a distinct space between candles where price has "jumped" without trading through the area. This gap represents an imbalance that often acts as a magnet, pulling price back to the area before continuing in the prevailing trend direction.
Fair value gaps differ from traditional support and resistance zones in that they form much faster, giving traders using this concept a significant advantage in identifying potential reversal points with precision.
How to Identify Fair Value Gaps
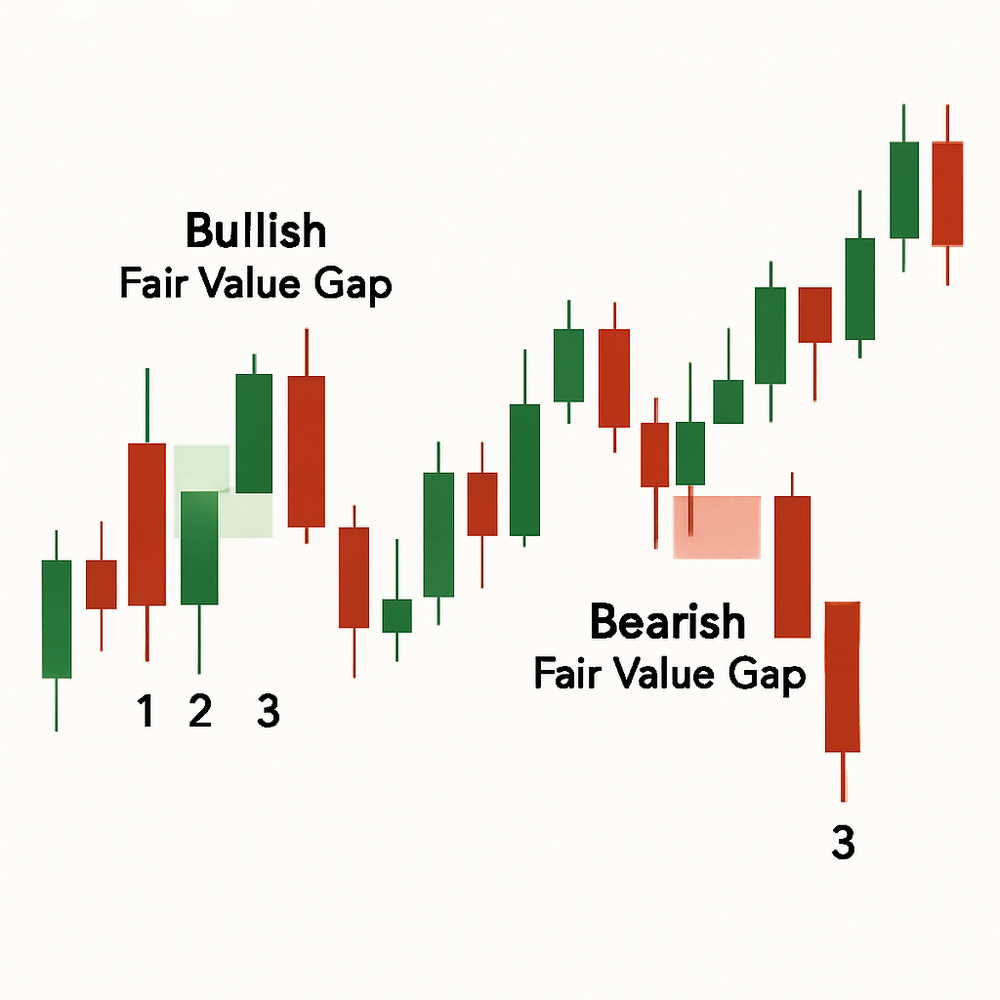
Fair value gaps follow a specific three-candle pattern that makes them relatively straightforward to identify once you understand the structure. There are two primary types of fair value gaps: bullish and bearish.
How to Find a Bullish Fair Value Gap
To identify a bullish fair value gap, follow these steps:
- Look for a green (bullish) candle that is noticeably larger than the candles on its left and right
- Verify that the high of the candle on the left does NOT overlap with the low of the candle on the right
- Draw a box where the bottom is the left candle's high and the top is the right candle's low
- Extend this box to the right of your chart
This box represents the bullish fair value gap. When price falls back into this zone, it often reverses and continues upward. If price breaks below the bottom of the bullish FVG, the pattern is invalidated.
How to Find a Bearish Fair Value Gap
To identify a bearish fair value gap, follow these steps:
- Look for a red (bearish) candle that is noticeably larger than the candles on its left and right
- Verify that the low of the candle on the left does NOT overlap with the high of the candle on the right
- Draw a box where the top is the left candle's low and the bottom is the right candle's high
- Extend this box to the right of your chart
This box represents the bearish fair value gap. When price rises into this zone, it often reverses and continues downward. If price breaks above the top of the bearish FVG, the pattern is invalidated.
The Theory Behind Fair Value Gaps
Understanding the market mechanics behind fair value gaps helps traders appreciate why these patterns are so effective. When a large price movement occurs, it typically represents a significant order being executed. This sudden price change creates an imbalance in the market.
In normal conditions, after a large price spike, traders holding positions often take profits, causing price to retrace. However, when price continues in the same direction after a spike without retracing, it signals that market participants believe the new price level is justified and are willing to continue holding or even add to their positions.
For example, if a stock typically fluctuates between $9-10, and suddenly jumps to $11 on positive news, traders may now consider $10-11 as the new "fair value" range. When price eventually retraces to this range, buyers often step in, believing they're getting a good deal at the new fair value level.
This market psychology explains why price frequently returns to fair value gaps before continuing in the trend direction – the market is simply establishing a new equilibrium after a rapid price change.
How to Trade Fair Value Gaps
Trading fair value gaps effectively requires a systematic approach. Here's a step-by-step strategy for incorporating FVGs into your trading:
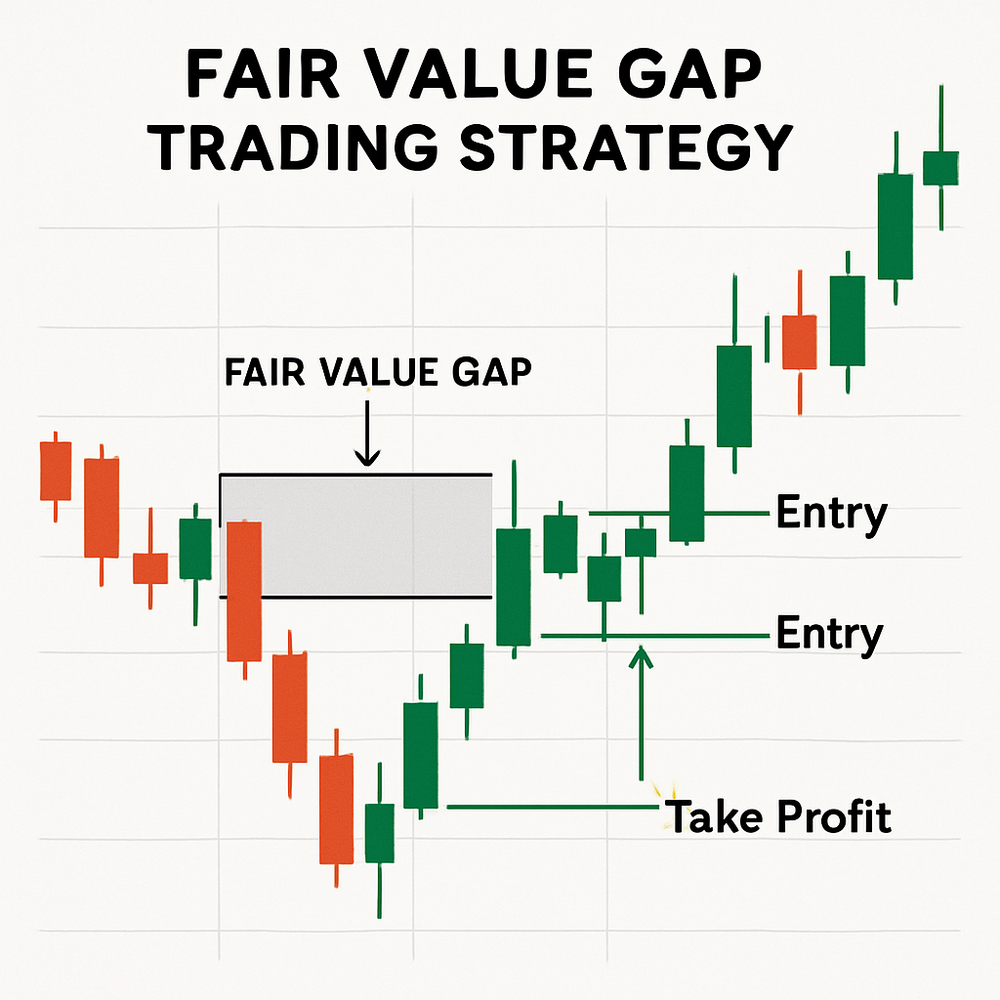
Step 1: Identify the Fair Value Gap
Use the methods described earlier to locate bullish or bearish fair value gaps on your chart. You can do this manually or use specialized indicators that automatically detect these patterns.
Step 2: Wait for Price to Return to the FVG
After identifying a fair value gap, patience is key. Wait for price to retrace back to the FVG zone. This retracement represents the market attempting to "fill" the gap and establish a new equilibrium.
Step 3: Look for Confirmation Signals
When price enters the FVG zone, look for confirmation signals before entering a trade:
- Candlestick patterns (like pin bars, engulfing patterns)
- Volume increases
- Momentum indicator divergences
- Support from other technical levels
Step 4: Enter Your Position
For bullish FVGs:
- Enter a long position when price enters the FVG zone and shows signs of reversal
- Place your stop loss below the bottom of the FVG
- Set take profit targets at previous resistance levels or using a risk-reward ratio
For bearish FVGs:
- Enter a short position when price enters the FVG zone and shows signs of reversal
- Place your stop loss above the top of the FVG
- Set take profit targets at previous support levels or using a risk-reward ratio
Step 5: Manage Your Trade
As the trade progresses:
- Consider moving your stop loss to breakeven once price moves in your favor
- You may take partial profits at predetermined levels
- Trail your stop loss to protect profits as the trade develops
Fair Value Gaps Across Different Timeframes
Fair value gaps can be identified and traded across multiple timeframes, though their reliability and characteristics may vary.
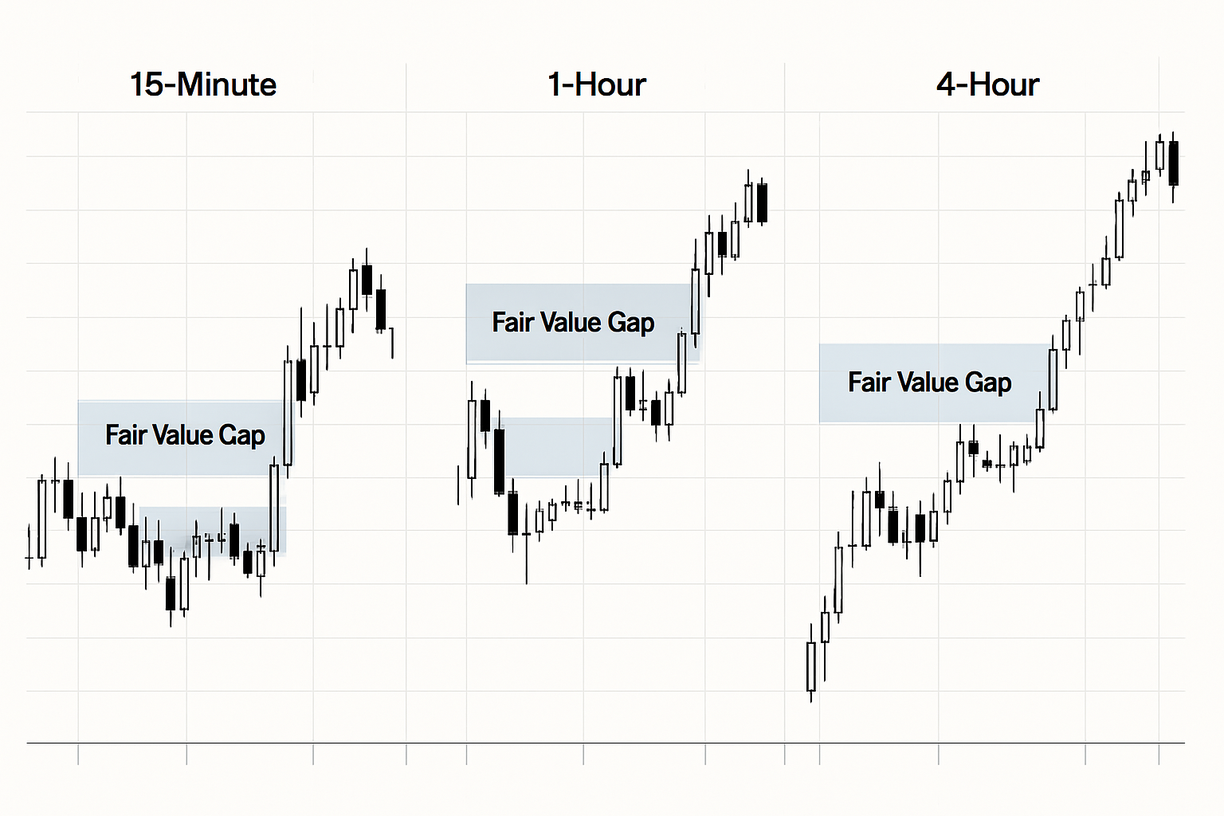
Intraday timeframes (3-minute, 5-minute, 15-minute) tend to produce the most frequent fair value gap opportunities. These shorter timeframes capture the quick market imbalances that create FVGs.
Higher timeframes (1-hour, 4-hour, daily) produce fewer but often more significant fair value gaps. These FVGs typically represent major market imbalances and can lead to substantial price movements when filled.
For optimal results, many traders use a multi-timeframe approach:
- Identify the trend on a higher timeframe
- Look for fair value gaps on a lower timeframe that align with the higher timeframe trend
- Enter trades when price returns to these aligned FVGs
Using Fair Value Gaps in Confluence with Other Concepts
Fair value gaps become even more powerful when used in conjunction with other technical analysis concepts. This approach, known as trading with confluence, significantly increases the probability of successful trades.
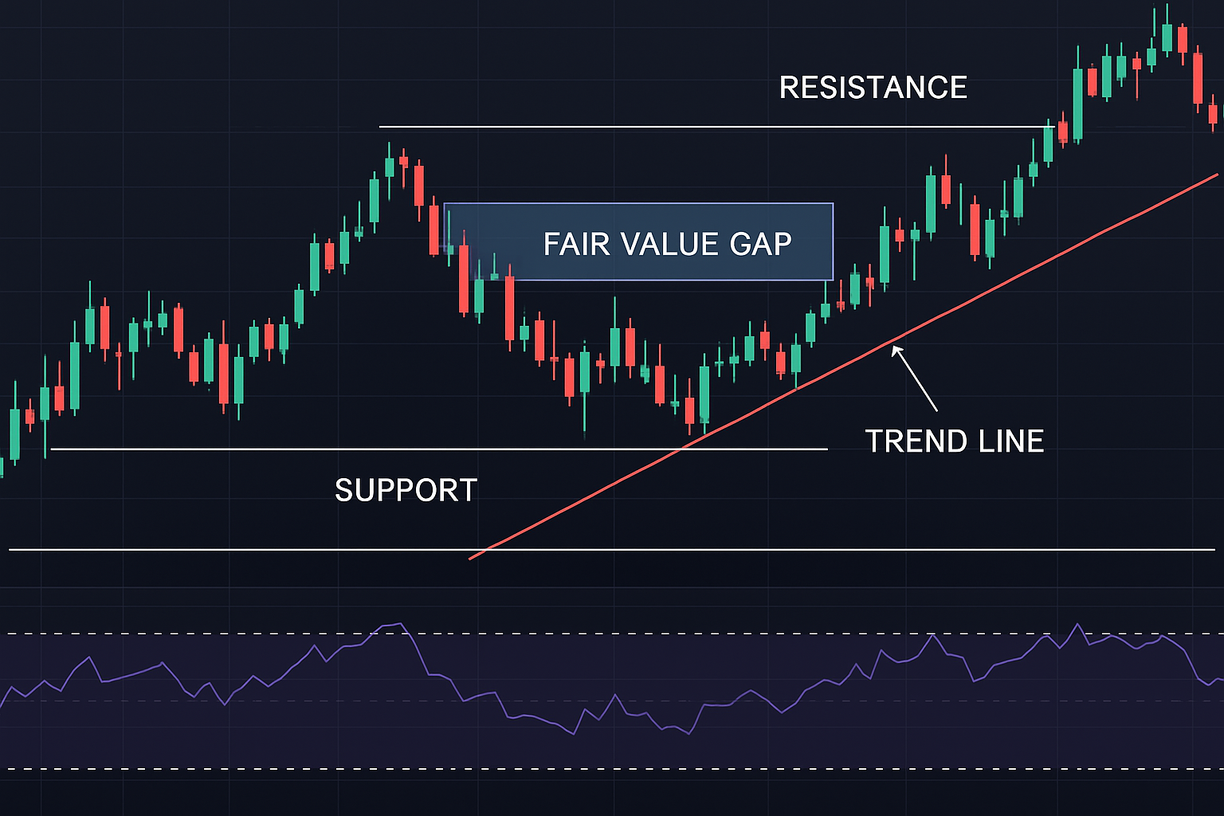
Effective confluence factors to combine with FVGs include:
-
Support and Resistance Levels: When a fair value gap aligns with a key support or resistance level, the probability of a reversal increases substantially.
-
Trend Lines: FVGs that form near trend lines often provide excellent entry opportunities in the direction of the trend.
-
Fibonacci Retracement Levels: When a fair value gap coincides with a key Fibonacci level (like 61.8% or 78.6%), it creates a strong zone for potential reversals.
-
Order Blocks: The combination of an order block and a fair value gap creates an extremely powerful zone for trade entries.
-
Volume Analysis: Increased volume when price returns to an FVG suggests strong interest at that level, increasing the likelihood of a reversal.
By combining these concepts, traders can develop a robust trading strategy that filters out lower-probability setups and focuses on high-quality opportunities.
FAQ
Can you trade Fair Value Gaps by themselves?
No, fair value gaps should not be traded in isolation. They work best when used in confluence with other trading concepts in your overall strategy. Combining FVGs with support/resistance, trend analysis, and other confirmation signals significantly improves results.
Can you trade Fair Value Gaps in any market?
Yes, fair value gaps can be identified and traded in virtually any market, including stocks, forex, cryptocurrencies, and futures. They work particularly well in markets with high trading volume and liquidity.
Can you trade Fair Value Gaps in any timeframe?
Yes, fair value gaps can be traded across all timeframes, though intraday charts (15-minute, 30-minute, 1-hour) typically provide the most opportunities. Higher timeframe FVGs (4-hour, daily) tend to be more significant but occur less frequently.